To receive James Stanley’s Analysis directly via email, please sign up here.
Talking Points:
- GBP/USD Technical Strategy: Longer-term price action remains subdued below historically low levels; near-term bullish structure.
- The Cable continues to show support/resistance inflections using the Fibonacci retracement around the post-Brexit move in the pair.
- SSI - If you’re looking for trading ideas, check out our Trading Guides. And if you want something more short-term in nature, check out our SSI indicator. If you’re looking at opening a trading account, FXCM has a contest at the beginning of next month for certain account holders. Click here for full details.
In our last article, we looked at the bullish price action structure in GBP/USD as a pivotal resistance structure around the major psychological level at 1.3500 neared. As we noted, traders looking to get long would likely want to wait for a deeper retracement in the effort of buying ‘higher-low’ support. We had discussed the reasons behind such a move two weeks ago in the article, Carney’s Lament, and should inflationary pressure continue to be a concern for the U.K. after the ‘sharp repricing’ in the British Pound in the wake of the Brexit referendum, this could lead to continued bullishness in the Sterling.
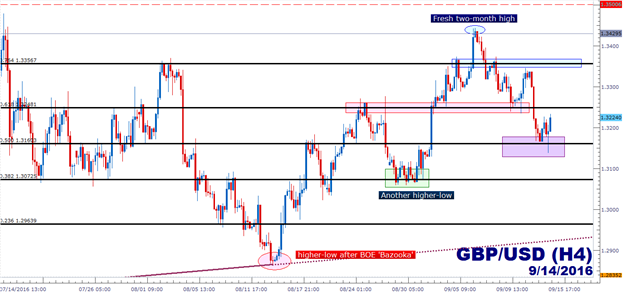
The post-Brexit range in the Cable continues to show support and resistance with a Fibonacci retracement drawn over the range; taking the high of 1.3523 that came in on 6/29 to the 1.2788 low that showed up a few days later. This was just after Mark Carney warned of impending rate cuts in response to Brexit, and helped to ramp up rate-cut bets in anticipation of a proactive response to Brexit. That swing-low has yet to give way, even after the BOE delivered considerably more than what markets were looking for at their August meeting; and when price action doesn’t make a lower-low after an extremely bearish driver, that could be telling us something (extremely oversold).
As prices in GBP/USD began sliding lower last week after approaching the confluent batch of resistance around 1.3500, price action found resistance off of the 76.4% retracement, support at the 61.8% retracement, and now support at the 50% level; and each of these instances are not the first iteration of these levels coming in as support or resistance. The prior swing-low of the move showed up at the 38.2% retracement, so traders could continue to build approaches utilizing this Fibonacci structure.
Traders looking to get long ahead of tomorrow’s BOE meeting would likely want to investigate stops based on this structure of support/resistance; with aggressive approaches looking to place risk levels below today’s low of 1.3137, and more conservative approaches looking to place stops below the prior swing around 1.3050. On the upside, traders could target levels at 1.3357 (76.4% retracement of the post-Brexit move), followed by 1.3430 (most recent swing-high), followed by 1.3500 (the Financial Collapse low).
Created with Marketscope/Trading Station II; prepared by James Stanley
--- Written by James Stanley, Analyst for DailyFX.com
To receive James Stanley’s analysis directly via email, please SIGN UP HERE
Contact and follow James on Twitter: @JStanleyFX
original source

