To receive James Stanley’s Analysis directly via email, please sign up here.
Talking Points:
- GBP/USD Technical Strategy: Flat, previous long closed at market
- A weak US Dollar has brought considerable strength in the Cable, with the 2016 high now in-sight.
- If you’re looking for more trade ideas, check out our Trading Guides; they’re free.
In our last article, we looked at a potential bearish reversal pattern in GBP/USD after the pair had run into a stubborn Fibonacci resistance level. As we had written, there weren’t yet enough signs of a turn to trigger the bearish position; but there were enough warning signs to allow for a market closure of the previous bullish position.
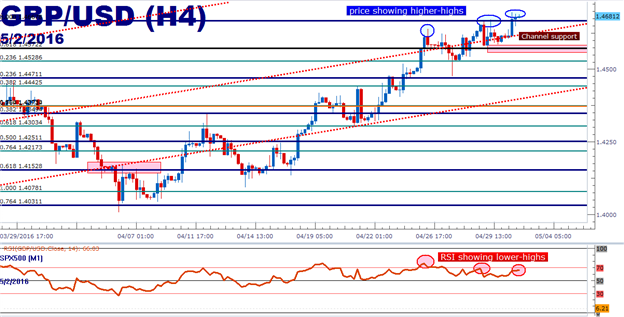
Since then, the Cable has continued to run higher, breaking above the pivotal swing-high at 1.4668, and coming within 120 pips of the 2016 high in the pair (set on January 4th). The pair is overbought by many metrics, and 4-hour RSI has begun to show signs of divergence as higher-highs are printing on price action while lower-highs are showing on the indicator (shown below).
Again, this is a bearish signal potentially highlighting a nearby turn: RSI divergence is indicative of a waning trend. But at this point, price action does not agree as we’ve seen continued higher-highs and higher-lows. The level of interest for top-side re-entries is 1.4572, which is the 61.8% retracement of the 30-year move in GBP/USD, using the low of 1.0500 when George Soros ‘broke’ the Bank of England with the high set in 2008 just before the Financial Collapse.
Traders could look for top-side re-entries should price action move down to find support at this level. Or for those that wanted to look to get long at a slightly more conservative level could wait for support to show at the 1.4471 zone, which is the 23.6% retracement of the most recent major move. If prices put in a concerted break below this support (highlighted with a daily close below this level); then bearish positions may be shortly on the horizon as price action would be in the early stages of showing bearish formations.
Created with Marketscope/Trading Station II; prepared by James Stanley
--- Written by James Stanley, Analyst for DailyFX.com
To receive James Stanley’s analysis directly via email, please SIGN UP HERE
Contact and follow James on Twitter: @JStanleyFX
original source

