To receive James Stanley’s Analysis directly via email, please sign up here.
Talking Points:
- GBP/USD Technical Strategy: Flat.
- The Cable has put in a vertical-like price movement today; but traders need to be cautious of chasing here as risk-reward is unattractive with the current technical setup.
- If you’re looking for more trade ideas, check out our Trading Guides; they’re free. And if you’re looking to open a trading account, FXCM is holding a contest for certain new account holders. Click here for full details.
In our last article, we looked at the continued bullish structure in GBP/USD despite the fact that we had just seen five consecutive days of softer prices. As we had written, price action staying above the Fibonacci support level at 1.4302, or the most recent ‘higher-low’ in the pair maintained the bullish structure in the pair. We pointed to the upcoming batch of announcements set to come out during Super Thursday, when the Bank of England had a rate decision while also releasing the minutes from that meeting along with Quarterly Inflation Forecasts as the potential driver behind the next wave of Sterling volatility. Such an event is an opportune time for trends to confirm or die-out; and as we wrote shortly after the announcement the GBP/USD would likely remain a viable candidate for those looking to sell US Dollars despite the fact that the Bank of England reduced growth and inflation forecasts.
Since last Thursday, we’ve seen a major gust of strength in the Cable, and this only furthers the bullish structure that’s been building in the pair for the better part of the past 2.5 months. The obfuscation at this point is one of entry, as we’re more than 200 pips away from that most recent support inflection at 1.4412, and the 2016 high in the pair is a mere ~50 pips away. So risk-reward may be a challeng on continuation setups at this point. Also of interest is price action behavior once we approach that 2016 high; and whether we can punch through to the other side or whether we make a higher-low before investigating reversal setups.
For traders looking to get long, there are two support levels to watch for that next batch of ‘higher-low’ support. The price zone between 1.4550 to 1.4572 could be a key area of interest. The price of 1.4572 is the 61.8% retracement of the 31-year move in the pair, taking the 1985 low of 1.0500 to the 2008 high of 2.1160 (shown in black on the below chart). Perhaps more importantly, this level has seen quite a few price action inflections since that high was made just before the Financial Collapse, and so far on the trading day price action has broken through that price with little regards for resistance. Twenty-five pips below that level we have the 23.6% retracement of the most recent move, taking the February low to the May high in the Cable (shown in purple below). Traders can look for price action to develop support in this zone before triggering long with targets cast towards that 2016 high of 1.4769.
For traders that want to approach a bit more conservatively, there’s another batch of potential support to watch in the 1.4371-1.4412 vicinity. The 1.4371 level is 76.4% retracement of the 2009-2014 move and 1.4412 is the 38.2% retracement of that same most recent major move.
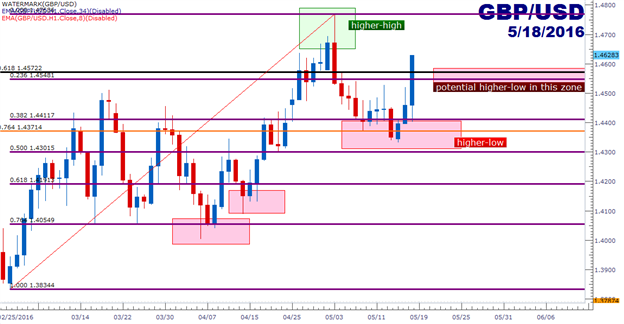
Created with Marketscope/Trading Station II; prepared by James Stanley
--- Written by James Stanley, Analyst for DailyFX.com
To receive James Stanley’s analysis directly via email, please SIGN UP HERE
Contact and follow James on Twitter: @JStanleyFX
original source

