- EURUSD, GBPUSD, USDCHF momentum is absent
- USDJPY ‘priced’ at channel
- USDCAD trend resumption
--Friday’s DailyFX Plus webinar (video is titled Jamie’s Trading Webinar 04-11-2014).
--Subscribe to Jamie Saettele's distribution list in order to receive a free report to your inbox once a day.
--Trading specifics are availabletoJ.S. Trade Desk members.
EUR/USD
Weekly
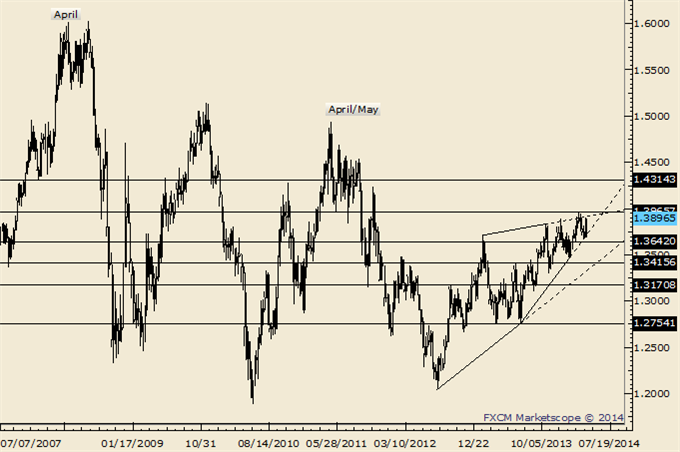
Chart Prepared by Jamie Saettele, CMT using Marketscope 2.0
Automate trades with Mirror Trader
-EURUSD was never able to drop under 1.3642, finding low after NFP at 1.3672. Momentum wise, I am looking for a top. RSI at each top since December has been below 70. This weak momentum profile is not suggestive of a strong bull.
-1.3909 is possible resistance before the high. If the rate does trade to a new high, then a drop back into the range would be required in order to create a tradable high. It’s worth mentioning that important tops have formed in April/May in recent years.
GBP/USD
Monthly
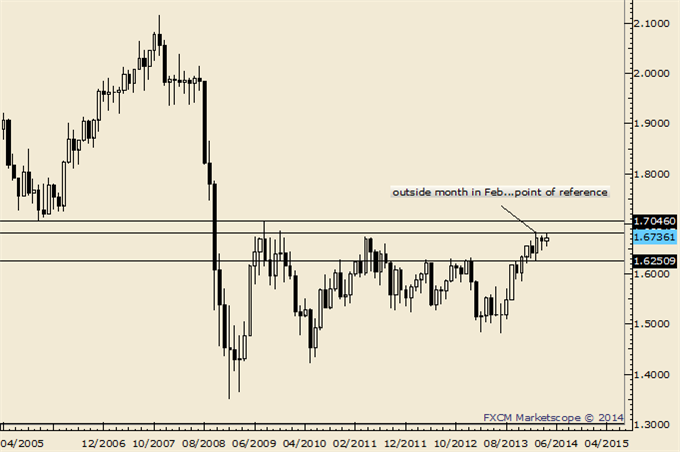
Chart Prepared by Jamie Saettele, CMT using Marketscope 2.0
Automate trades with Mirror Trader
-GBPUSD upside pressures remain intact. The line that extends off of the October and 1/2 highs crosses through the middle of the 2/17 high, which was tested this week. The line that extends off of the November and February lows pinpointed the 3/24 low. A break of the support line would suggest that February’s outside month was exhaustive.
-The momentum profile described regarding EURUSD applies to GBPUSD too. In fact, daily RSI hasn’t been above 70 since the October top. Don’t forget about extreme COT readings.
AUD/USD
Weekly
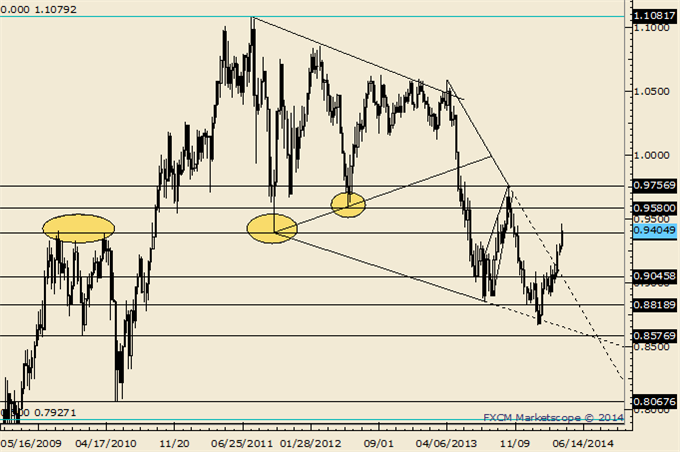
Chart Prepared by Jamie Saettele, CMT using Marketscope 2.0
Automate trades with Mirror Trader
-“AUDUSD has broken out. The head and shoulders measured target is .9500/11 but there a good deal of levels before then that could inspire a reaction. The levels in question are .9320s (see June-July levels) and .9386-.9405 (2009 high / 2011 low).” AUDUSD closed above .9405 on Thursday before pulling back on Friday. This is a great place for a sharp pullback.
-Short term structure allows for another high but this is a great place for a pullback into at least the .9260s.
NZD/USD
Monthly
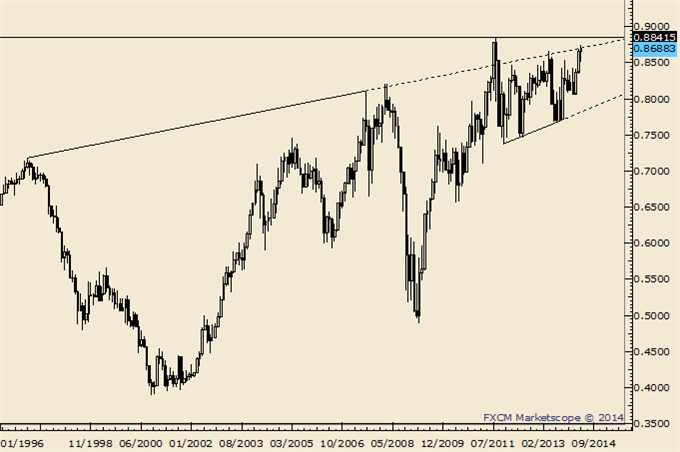
Chart Prepared by Jamie Saettele, CMT using Marketscope 2.0
Automate trades with Mirror Trader
-NZDUSD retraced last week’s outside week reversal and pulled back to end the week near the 2013 high.
-Don’t forget about the line that extends off of the 1996 and 2007 highs. That line crosses through the 2008, 2011, and highs as well. We are there now. In 2011 (record free float high), the rate surged through the line in late July before topping on August 1st.
USD/JPY
Monthly
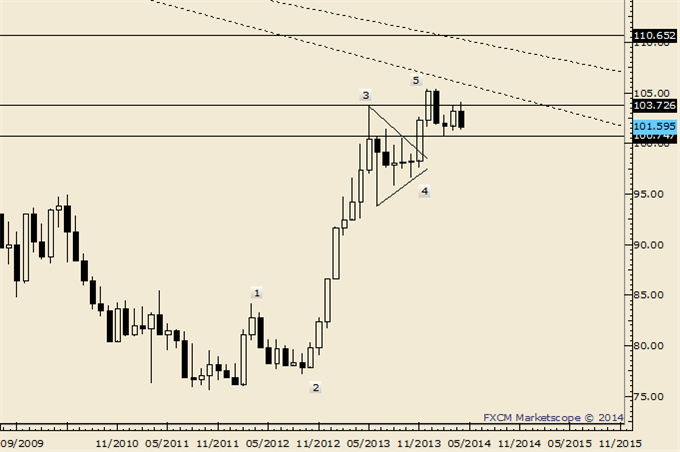
Chart Prepared by Jamie Saettele, CMT using Marketscope 2.0
Automate trades with Mirror Trader
-USDJPY is trading on support from the line that extends off of the February and 3/14 lows. The rally from the February low channels in a corrective manner and makes 104.12 important from a bigger picture bearish perspective.
-There is an Elliott case to be made for a return to the 4thwave of one less degree. The range spans 93.78 to 96.55. Of course, the path to get to that level is far from clear. Respect breakdown potential as long as price is below 102.50.
USD/CAD
Monthly
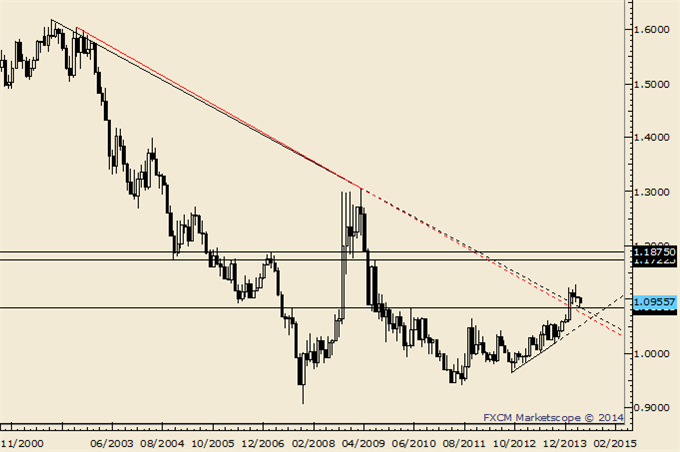
Chart Prepared by Jamie Saettele, CMT using Marketscope 2.0
Automate trades with Mirror Trader
-Measured objectives from the breakout above the 2011 high range from 1.1680 to 1.1910. The Jul 2009 high rests in this zone at 1.1724 and the 2007 high is near the top of the zone at 1.1875.
-From an Elliott perspective, it’s possible that the rally from the 2012 low composes a ‘3rd of a 3rd (or C)’ wave from the 2007 low.
-Action since the January high may compose a flat. The low at 1.0857 is in line with major inflection points on recent years as well as the 1/13 low (1.0842).
USD/CHF
Weekly
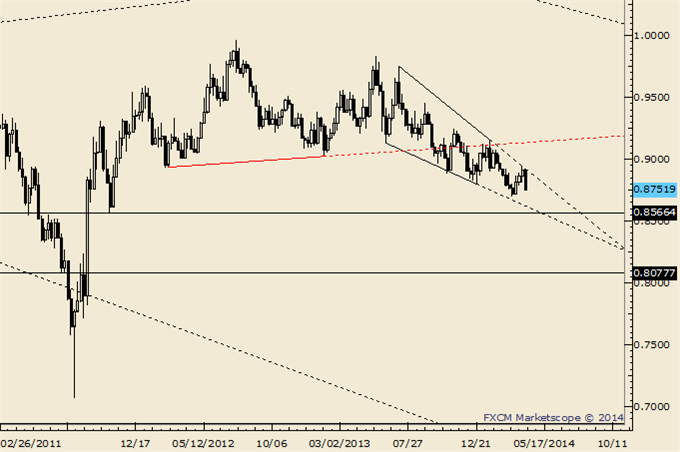
Chart Prepared by Jamie Saettele, CMT using Marketscope 2.0
Automate trades with Mirror Trader
-The same momentum considerations that apply to EURUSD apply to USDCHF (the March price low occurred with RSI above 30).
-Patter wise, the decline from the 2012 high ‘fits’ well as a 3 wave correction with wave C as an ending diagonal. When (if) this market turns is up in the air. In the event of new lows, watch .8566-.8640. Above .8844 begins to turn things constructive again.
original source


