Talking Points:
- USD/CAD Preserves Bullish Formation Despite Sticky Canada CPI, Oil Rebound.
- AUD/USD Climbs to Fresh Monthly High- RBA Governor Stevens in Focus .
- USDOLLAR to Mount Larger Rebound in Strong 3Q GDP Report.
For more updates, sign up for David's e-mail distribution list.
USD/CAD
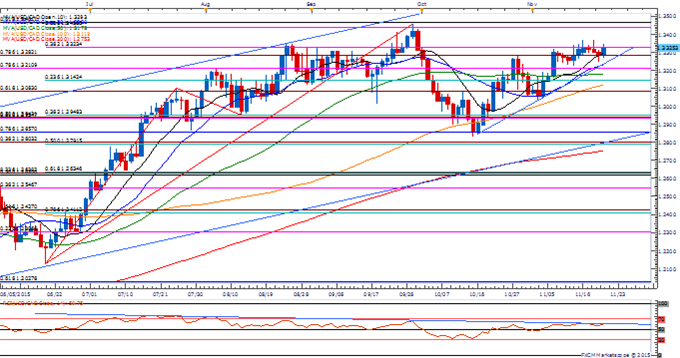
Chart - Created Using FXCM Marketscope 2.0
- Despite the stickiness in Canada’s Consumer Price Index (CPI), USD/CAD appears to be coiling for a move higher as it preserves the upward trend carried over from the previous month; waiting for the Relative Strength Index (RSI) to break out of the bearish formation from July for conviction/confirmation for a further advance in the exchange rate.
- Seems as though cross-market relationships are decoupling going into the last full-week of November as the Canadian dollar fails to benefit from the rebound in crude oil prices; key topside region of interest comes in around 1.3440 (50% expansion) to 1.3460 (61.8% retracement).
- The DailyFX Speculative Sentiment Index (SSI) shows retail crowd remains net-short USD/CAD since November 4, but the ratio appears to be working its way back towards recent extremes as it slips to -1.89, with 35% of traders now long.
AUD/USD
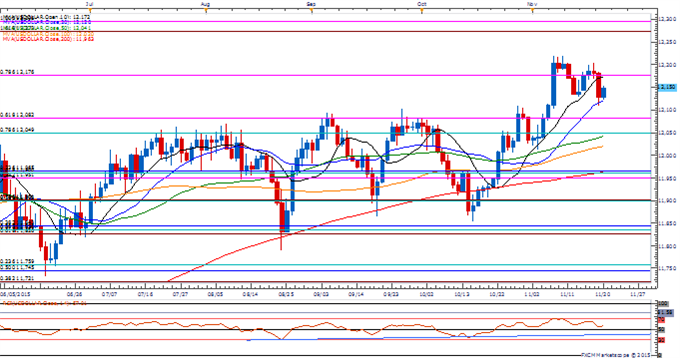
- AUD/USD may continue to recoup the decline from the previous month as the pair pushes to fresh monthly highs and breaks out of the downward trending channel carried over from October.
- With Reserve Bank of Australia (RBA) Governor Glenn Stevens scheduled to speak in the week ahead, the fresh comments may shape market expectations for the December 1 interest rate decision as the central bank keeps the door open to further embark on its easing cycle.
- Break/close above the near-term hurdle around 0.7240 (100% expansion) to 0.7270 (38.2% retracement) raises the risk for a move at the October high (0.7381).
Join DailyFX on Demand for Real-Time SSI Updates Across the Majors!
USDOLLAR(Ticker: USDollar):
Index | Last | High | Low | Daily Change (%) | Daily Range (% of ATR) |
DJ-FXCM Dollar Index | 12150.89 | 12153.87 | 12124.29 | 0.18 | 63.79% |
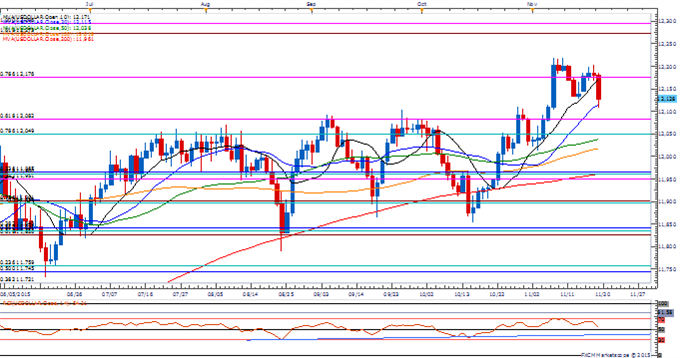
Chart - Created Using FXCM Marketscope 2.0
- The near-term pullback in the USDOLLAR could be short-lived as the preliminary 3Q Gross Domestic Product (GDP) report is expected to show an upward revision in the growth rate to reflect an annualized 2.1% rate of expansion.
- Signs of stronger growth accompanied by data highlighting sticky inflation may fuel speculation for a rate-hike at the Federal Open Market Committee’s (FOMC) December 16 interest rate decision; will also keep a close eye on the fresh rhetoric from San Francisco Fed President John Williams as sits as a voting-member in 2015.
- As USDOLLAR continues to hold above former-resistance around 12,049 (78.6% retracement) to 12,082 (61.8% expansion, will retain a constructive outlook for the greenback, with the next topside hurdles coming in around 12,273 (161.8% expansion) to 12,296 (100% expansion).
Read More:
Draghi’s Dovish Reminder Keeps EUR/USD Downtrend Intact
WTI Crude Oil Price Forecast: A Year-End Present For Bulls?
EUR/JPY on the Cusp of Important Move
US DOLLAR Technical Analysis: Set To Hold Key Support
--- Written by David Song, Currency Analyst
To contact David, e-mail dsong@dailyfx.com. Follow me on Twitter at @DavidJSong.
To be added to David's e-mail distribution list, please follow this link.
Trade Alongsidethe DailyFX Team on DailyFX on Demand
original source


