To receive Ilya's analysis directly via email, please SIGN UP HERE
Talking Points:
- USD/CAD Technical Strategy: Long at 1.0935
- Support: 1.0857 (Apr 9 low)
- Resistance: 1.1017-36 (14.6% Fib exp., trend line), 1.1116 (23.6% Fib exp.)
The US Dollar started to rise against its Canadian counterpart as expected after prices completed a Bullish Engulfing candlestick pattern. The pair is edging toward resistance in the 1.1017-42 area, marked by the 14.6% Fibonacci expansion and a rising trend line set from mid-January. A break above this threshold on a daily closing basis initially exposes the 23.6% Fib at 1.1116. Near-term support remains at 1.0857, the April 9 low.
We entered long USD/CAD at 1.0935 continue to hold the trade. A stop-loss is set to trigger on a daily close below 1.0857. Profit on half of the position is to be booked and the stop-loss trailed to breakeven at 1.1017.
Confirm your chart-based trade setups with the Technical Analyzer. New to FX? Start Here!
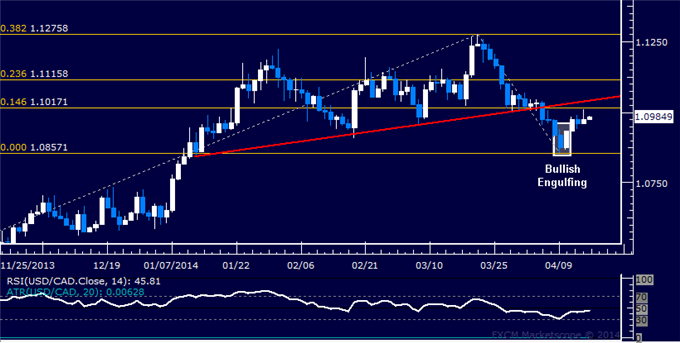
Daily Chart - Created Using FXCM Marketscope 2.0
--- Written by Ilya Spivak, Currency Strategist for DailyFX.com
original source


