To receive Ilya's analysis directly via email, please SIGN UP HERE
Talking Points:
- USD/CAD Technical Strategy: Flat
- Support: 1.1043, 1.0985, 1.0915
- Resistance: 1.1098, 1.1187, 1.1276
The US Dollar declined against its Canadian counterpart as expected after prices put in a bearish Dark Cloud Cover candlestick pattern. A daily close below the 1.0915-34 area marked by the 38.2% Fibonacci retracement and the September 2 high exposes the 50% level at 1.0859. Alternatively, a reversal back above the 23.6% Fib at 1.0985 clears the way for a test of the 14.6% retracement at 1.1028.
The available trading range is too narrow to justify entering a long or short trade at current levels from a risk/reward perspective. We will remain on the sidelines for now, waiting for a more actionable opportunity to present itself.
Add these technical levels directly to your charts with our Support/Resistance Wizard app!
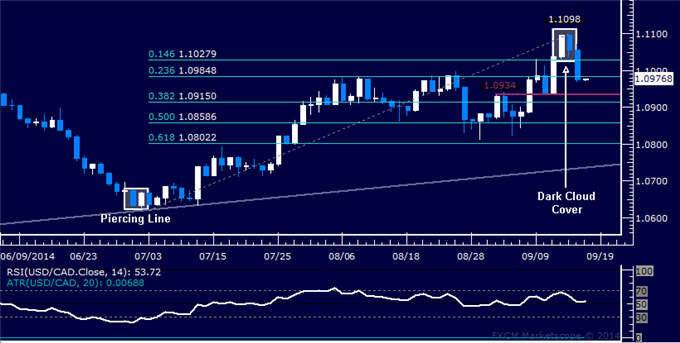
Daily Chart - Created Using FXCM Marketscope 2.0
--- Written by Ilya Spivak, Currency Strategist for DailyFX.com
original source


