To receive Ilya's analysis directly via email, please SIGN UP HERE
Talking Points:
- USD/CAD Technical Strategy: Flat
- Support: 1.2014, 1.1820, 1.1581
- Resistance: 1.2208, 1.2448, 1.2609
The US Dollar moved lower against its Canadian namesake as expected after prices produced a Shooting Star candlestick at trend line resistance. Near-term support is at 1.2014, the 50% Fibonacci retracement, with a break below that on a daily closing basis exposing the 61.8% level at 1.1820. Alternatively, a move back above the 38.2% Fib at 1.2208 clears the way for a test of the 1.2381-2448 area (January 27 low, 23.6% Fib).
The long-term USDCAD trend has favored the upside since September 2012. The boundaries of that advance firmly intact, making current weakness appear corrective. With that in mind, we will remain flat for now and wait for the pullback to yield a buying opportunity.
Add these technical levels directly to your charts with our Support/Resistance Wizard app!
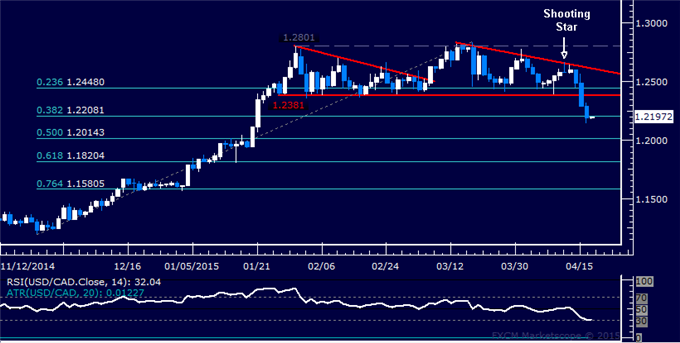
Daily Chart - Created Using FXCM Marketscope
--- Written by Ilya Spivak, Currency Strategist for DailyFX.com
original source


