To receive Ilya's analysis directly via email, please SIGN UP HERE
Talking Points:
- USD/CAD Technical Strategy: Flat
- Support: 1.1098, 1.0999, 1.0915
- Resistance: 1.1182, 1.1251, 1.1364
The US Dollar is aiming to build higher against its Canadian namesake after prices advanced to a six-month high. A daily close above the 61.8% Fibonacci expansion at 1.1182 exposes the 76.4% level at 1.1251. Alternatively, a turn below the 1.1098-1125 area marked by the September 15 top and the 50% Fib opens the door for a challenge of the 23.6% expansion at 1.0999.
Prices are wedged too closely between near-term support and resistance levels to justify entering a trade on the long or short side of the equation from a risk/reward perspective. With that in mind, we will remain on the sidelines for the time being.
Add these technical levels directly to your charts with our Support/Resistance Wizard app!
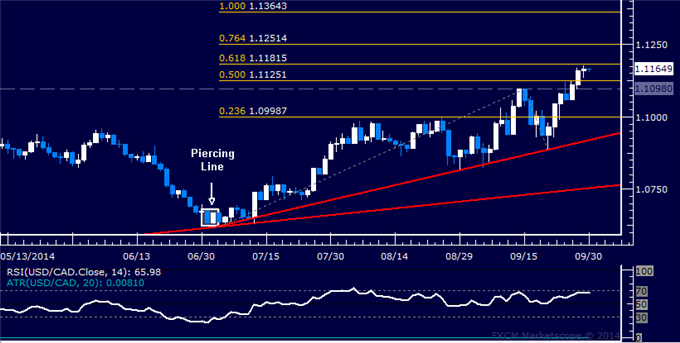
Daily Chart - Created Using FXCM Marketscope 2.0
--- Written by Ilya Spivak, Currency Strategist for DailyFX.com
original source


