As uncertainty reigns, recent price action suggests that, at least in the short term, the USDINR has found its feet. Here are the key levels to look out for to confirm or invalidate the bias.
From its April 2013 lows of around the 53.00 flat level, the USDINR experienced a tremendous six-month upside rally throughout the second and third quarters of last year. With the exception of a small period of consolidation over the summer, during which many traders likely took at least a portion of their profits of the table, the dollar gained almost over 30% over the rupee, reaching all-time highs just shy of 70.00 flat. From its highs however, the dollar gave back nearly half of its gains in under two months, bottoming out around 60.50 during mid-October. After about a month of strength, the dollar yet again dropped to this level at the beginning of December, from which up until the last few days it has traded with a relatively tight range between 61.00 and 62.30.
The question for the last few months has been, “Is this a reversal, or merely a correction of last year’s huge gains?” The question remains, but a look at recent price action could offer clues as to the potential answer.
USDINR Daily Chart
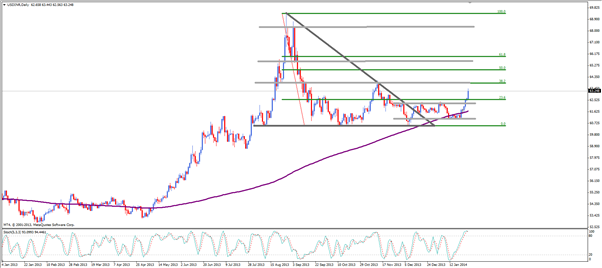
Take a look at the chart above showing price action in the USDINR on a daily timeframe. The first technical point of note is the large descending triangle that formed July-December. Traditionally, a descending triangle is a bearish pattern as the downwards sloping triangle top indicates weakening demand for an asset, in this instance the Dollar. This bias became invalid however on December 12, as price closed above the upper sloping triangle top. The bias was further invalidated as price retested the line on December 16, 17 and 18, only to find considerable support. Often lines of resistance, once broken, will become lines of support. When this happens it can be a strong bullish signal.
As aforementioned, having broken out of the triangle, price ranged to resistance at 62.30, right up until last Friday. Despite no real fundamental catalyst, no positive USD news or negative INR news for example, the USD broke out of its range to close around 62.55. Monday and Tuesday gains this week see price see price closing in on 6-month highs around 64.00 flat, which also happens to be a 38.2% Fibonacci retracement of the initial downside move.
With a strong bearish bias neutralized, the pair’s future is once again uncertain. In all likelihood however, the next few days will offer a strong indication of the direction of the USDINR for the coming 3-6 months. If price fails to break 64.00, the key levels to watch will be the recently broken resistance at 62.55 and, below that, range support between 61.00 flat and the 60.50 support that formed the base of last year’s descending triangle.
Looking long, if price breaks through 64.00 it has a relatively clean run back up to the 68.00 flat level and perhaps beyond. Expect some resistance around 65.50-66.00, as a previous level of support/resistance combines with the 61.8% Fibonacci retracement of the initial downturn. If price does struggle to break through this region, it might indicate at least a temporary downside correction.
A look at the stochastic indicator offers some insight into the short-term. The stochastic oscillator measures the momentum in an assets movement, and because it is bound between a 20 and an 80 level, can indicate potential swing points. Anything above 80 indicates an overbought asset, so the USDINR’s reading of 94 suggests price could be due for a short-term downside correction. The combination of an overbought stochastic reading, a level of previous resistance and the 38.2% Fibonacci retracement suggests price may struggle to break 64.00 at first attempt. Often, to break through a level where a number of technical signals combine, there needs to be some sort of fundamental catalyst. If no positive news comes out of the U.S as price approaches 64.00, expect a temporary reversal; perhaps back down as far as the recently broken 62.55.
All said, the recent breakout has offered traders a certain level of clarity into the future direction of the pair, but price action around a number of key levels will be required to strengthen this insight.
original source

