Talking Points
- USD/JPY Technical Strategy: Longs Preferred
- Intraday Pullback Warns of A ‘False Breakout’
- H4 Chart Offered Early Indication of A Correction
USD/JPY may have witnessed a ‘false breakout’ if the current candle closes below the 104.00 barrier. However, the potential for a sustained correction may be limited given bearish reversal candlestick formations are lacking. Buyers interest would likely be renewed on a re-test of the psychologically-significant 103.00 floor.
USD/JPY: Awaiting Close of Candle to Confirm ‘False Breakout’
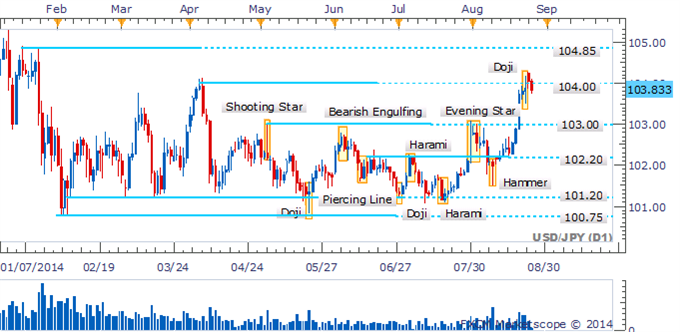
Daily Chart - Created Using FXCM Marketscope 2.0, Volume Indicator Available Here
A Harami formation on the four hour timeframe offered an early indication of the potential for a slight pullback. Some intraday support at 103.67 may see the pair’s descent slowed over the coming sessin.
USD/JPY: Harami Warned Of An Intraday Correction
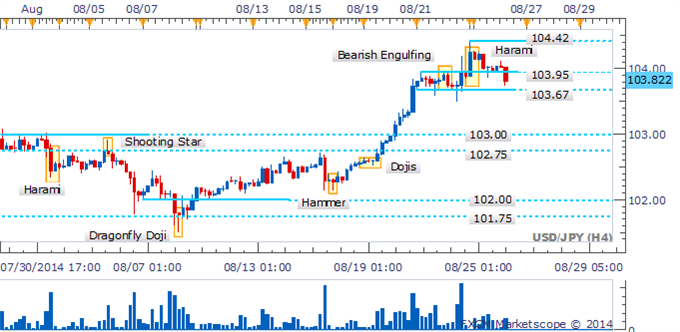
Four Hour Chart - Created Using FXCM Marketscope 2.0,Volume Indicator Available Here
By David de Ferranti, Currency Analyst, DailyFX
Follow David on Twitter: @Davidde
To receive David’s analysis directly via email, please sign up here.
Learn how to read candlesticks to help identify trading opportunities with the DailyFX Candlesticks Video Course.
original source


