- USDJPY signs of a major top
- AUDUSD reverses at year open…lookout below
- GBPUSD bear channel development
--Subscribe to Jamie Saettele's distribution list in order to receive a free report to your inbox thrice a week.
--Tradingideas are availabletoJ.S. Trade Desk members.
EUR/USD
Weekly
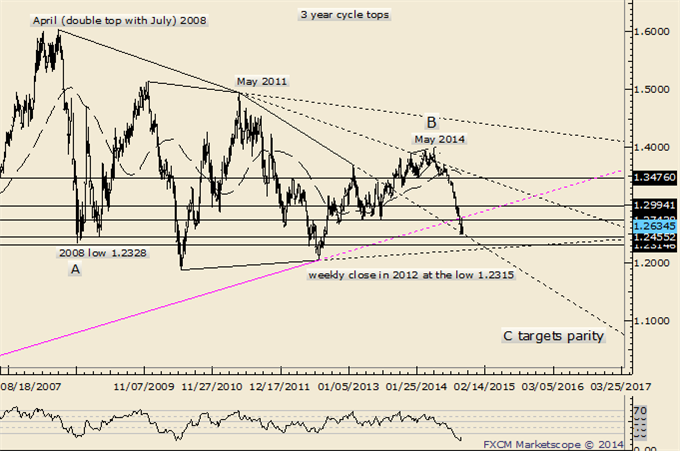
Chart Prepared by Jamie Saettele, CMT using Marketscope 2.0
Automate trades with Mirror Trader
-“In keeping with the 3 year cycle tops (2008, 2011, and 2014), EURUSD has collapsed. While the long term wave count points below 1.1875 (and to parity), one cannot ignore how extreme the current situation is and how long that extreme has been in place. Since the inception of the EURUSD, the rate had declined for 8 consecutive weeks once (March 2010). That resolved with a nearly 400 pip bounce before continued weakness. Last week marked the 12th consecutive decline. Weekly RSI is at its lowest level ever. The prior RSI low registered in May 2010. US Dollar Index COT is at a record. A countertrend surprise could happen at any time but I’d keep an eye on 1.2315-1.2400 (1998 high, 2008 low, weekly close of 2012 low week).”
-The bounce this week relieved daily oversold conditions (not weekly) and the rally failed at former support from lows in 2013. IF EURUSD trades to a new low while staying below 1.2791 THEN a 5 wave decline from the May high is probably nearing completion. 1.2315/28 would be of interest for a low. IF EURUSD exceeds 1.2791 while staying above 1.2500, THEN expect resistance between 1.2865 and 1.30 and a move to new lows thereafter.
GBP/USD
Weekly
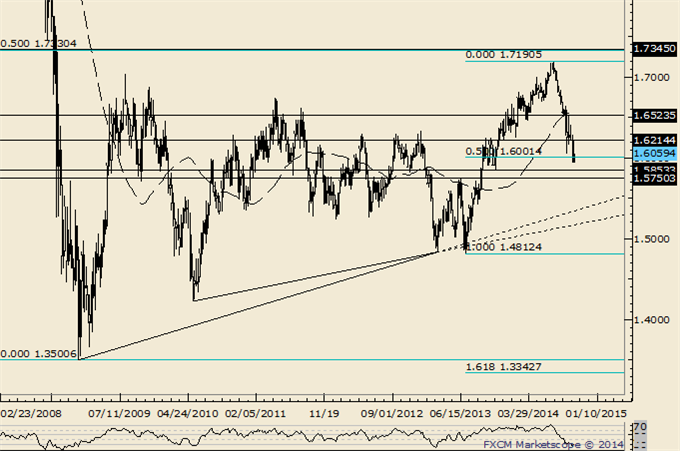
Chart Prepared by Jamie Saettele, CMT using Marketscope 2.0
Automate trades with Mirror Trader
-“GBPUSD has retraced half of the rally from the 2013 low and then some. The top side of the line that extends off of the 2011 and 2013 highs is a level to keep in mind but the next major support level is the November low at 1.5853, followed by the June 2013 high and 61.8% retracement at 1.5720/50. 1.6150-1.6224 is resistance.”
-GBPUSD traded into resistance and failed. Look lower as long as below this week’s high towards 1.5750.
AUD/USD
Weekly
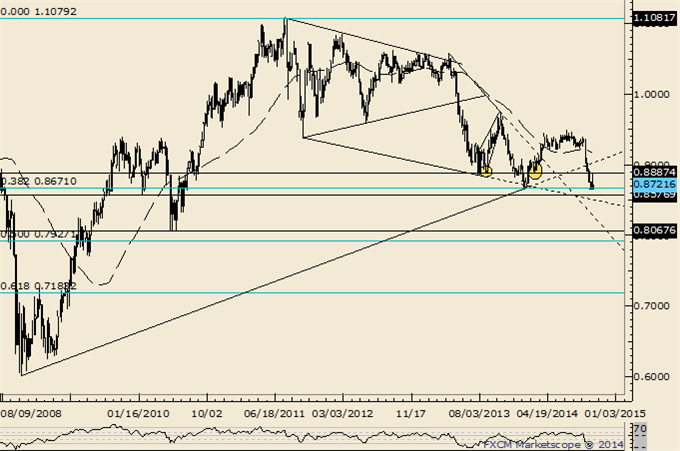
Chart Prepared by Jamie Saettele, CMT using Marketscope 2.0
Automate trades with Mirror Trader
-“The combination of the .9400 figure and weekly RSI failing near 60 indicates a lot of overhead to punch through. Since the 2011 top, each RSI failure near 60 has led to a top or topping process (range for several weeks then a breakdown...that may be the case now).”
-AUDUSD broke down from a head and shoulders top on 9/9. The target was reached 4 days after the pattern completed. Weakness has extended below the line that extends off of the 2008 and 2014 lows, warning of something much more significant on the downside. .8500 is a possible bounce level.
NZD/USD
Weekly
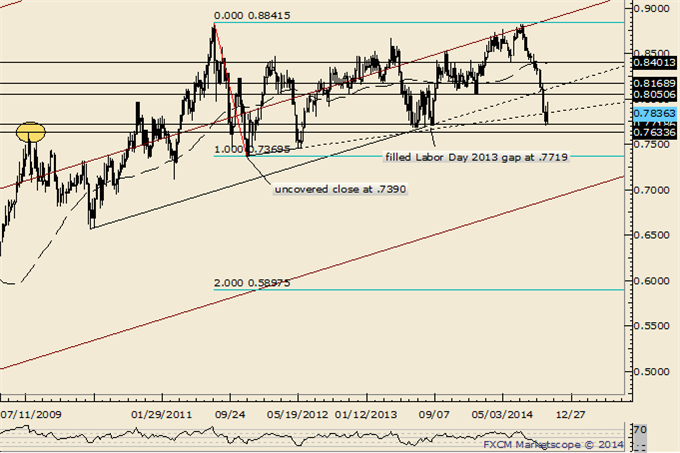
Chart Prepared by Jamie Saettele, CMT using Marketscope 2.0
Automate trades with Mirror Trader
-“Don’t forget about the line that extends off of the 1996 and 2007 highs. That line crosses through the 2008, 2011, and highs as well. In 2011 (record free float high), the rate surged through the line in late July before topping on August 1st. The rate reversed this week from pips below the record high and above the mentioned line.”
-“Above .8534 is needed in order to suggest that at least a minor low is in place. Look lower as long as price is below that level.” The pivot can be lowered to .8169. The February low is now resistance at .8050. The gap from Labor Day 2013 has held as support so far at .7720 but weakness below opens up the October 2009 high at .7634. Ultimately, weakness below .7370 would confirm a double top with an objective of .5898.
USD/JPY
Weekly
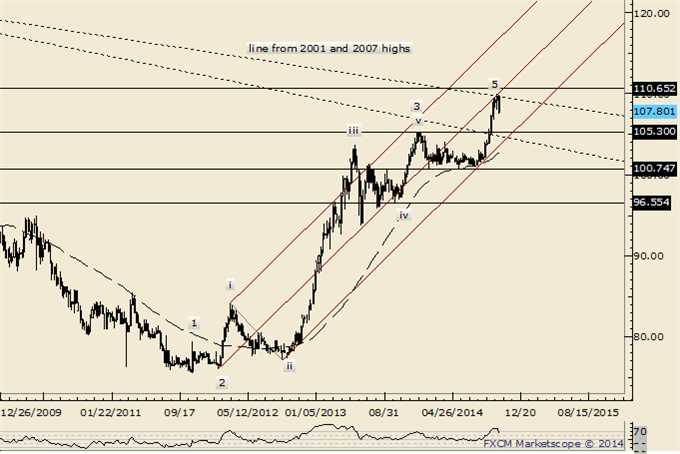
Chart Prepared by Jamie Saettele, CMT using Marketscope 2.0
Automate trades with Mirror Trader
-“Treat wave 4 as complete as long as price is above 102.50 (103.00/30 is support). That means new highs in wave 5 (then risk of a major decline but don’t forget that ‘5ths’ can extend). 104.75 is a near term target.”
-“Focus is now on expansion targets at 108.33 and 110.12 as long as price is above 103.50.” The first target has already been reached and the top is 4 pips from the latter level. 5 waves up from the 2011 low are counted which raises the risk of a sharp reversal lower from the trendline that extends off of the 2001 and 2007 highs. 106.80 and 105.40 are reaction levels (support).
USD/CAD
Monthly
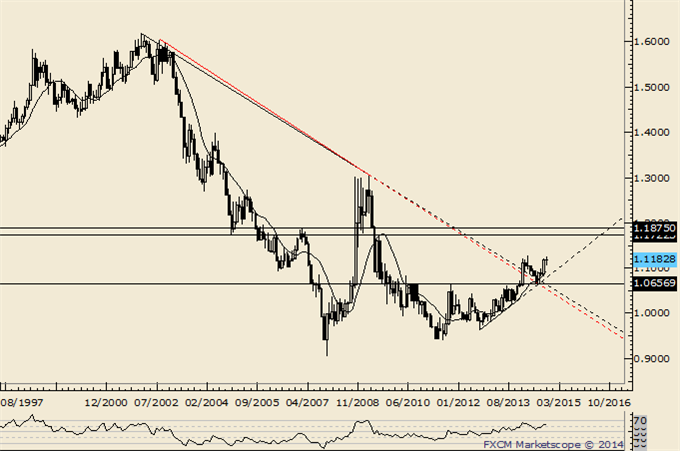
Chart Prepared by Jamie Saettele, CMT using Marketscope 2.0
Automate trades with Mirror Trader
-“USDCAD has fallen apart which ironically means it is probably going to find some sort of low soon. The rate is nearing important price levels. The 2011 high at 1.0657 and current year open at 1.0634 are possible supports. The line that extends off of the 2012 and September 2013 lows is at about 1.0607 next week. This level is in line with the July 2013 high at 1.0608.” USDCAD ended up finding low at 1.0620.
-The USDCAD dip from 1.0997 found support at the 50% retracement of the 1.0620-1.0997 advance (the 61.8% is at 1.0764). The hold is a positive sign and I lean towards the upside until at least 1.1720-1.1875.
USD/CHF
Weekly
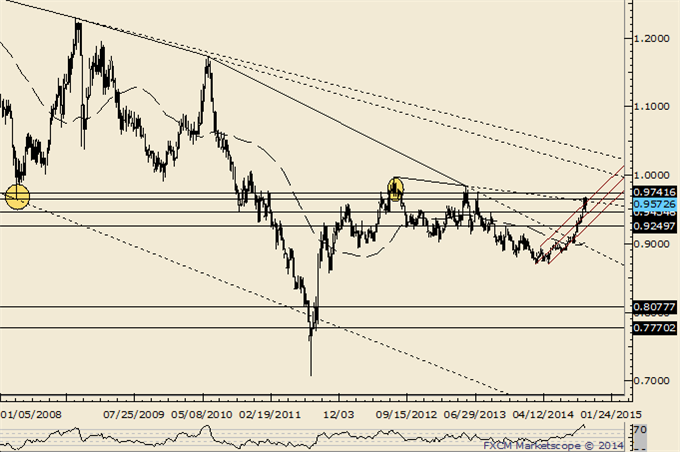
Chart Prepared by Jamie Saettele, CMT using Marketscope 2.0
Automate trades with Mirror Trader
-USDCHF has pulled back from near the 2008 low at .9645. The July 2013 high at .9750 is in line with the close of the week that produced the 2012 high at .9742. IF a new high is made while price above .9468 THEN that zone may produce a top for a 5th wave high. IF price trades below .9468 while below .9684 THEN look for support near .9400/30.
original source


