To receive Ilya's analysis directly via email, please SIGN UP HERE
Talking Points:
- USD/JPY Technical Strategy: Flat
- Support: 108.22, 107.47, 106.24
- Resistance: 109.22, 109.96, 110.71
The US Dollar may turn lower against the Japanese Yen after prices put in a bearish Harami candlestick pattern. A daily close below the 14.6% Fibonacci retracement at 108.22 exposes the 23.6% level at 107.47. Alternatively, a reversal above the 38.2% Fib expansion at 109.22 opens the door for a challenge of the 50% threshold at 109.96.
A Harami pattern does not amount to an actionable trade signal by itself without further confirmation. With that in mind, we will opt to remain on the sidelines for the time being, waiting for a more concrete opportunity to present itself.
Add these technical levels directly to your charts with our Support/Resistance Wizard app!
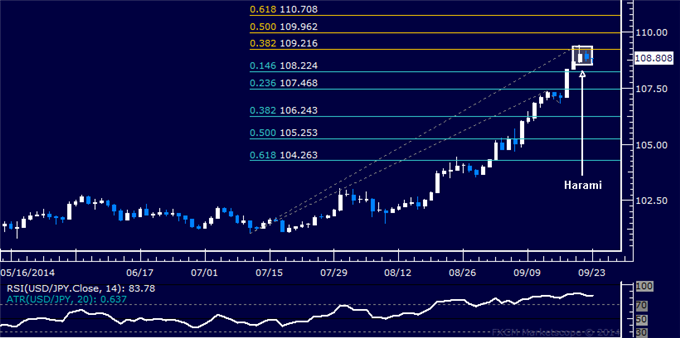
Daily Chart - Created Using FXCM Marketscope 2.0
--- Written by Ilya Spivak, Currency Strategist for DailyFX.com
original source


