To receive Ilya's analysis directly via email, please SIGN UP HERE
Talking Points:
- USD/CHF Technical Strategy: Flat
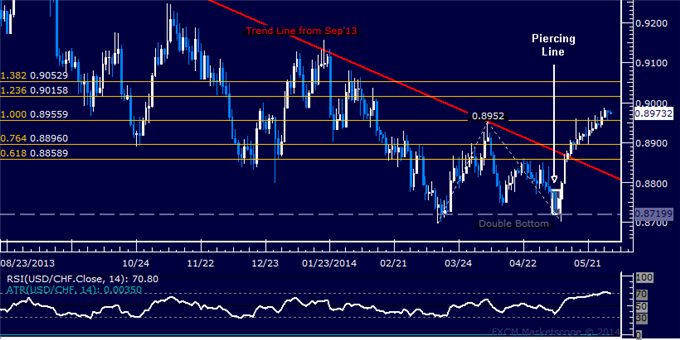
- Support:0.8952-56 (Apr 4 high, 100% Fib exp.), 0.8896 (76.4% Fib exp.)
- Resistance: 0.9016 (123.6% Fib exp.), 0.9053 (138.2% Fib exp.)
The US Dollar rose against the Swiss Franc as expected after prices put in a bullish Piercing Line candlestick pattern. The pair has finally overcome resistance in the 0.8952-56 area, marked by the 100% Fibonacci expansion and the April 4 high, exposing the 123.6% level at 0.9016. A further push beyond that targets the 138.2% Fib at 0.9053. Alternatively, a reversal back below 0.8952 opens the door for a decline to the 76.4% Fibat 0.8896.
While a long a position appears reasonable from a risk/reward perspective, we will tactically opt to stand aside. The inverse correlation between USDCHF and EURUSD is now 0.92 on 20-day percent change studies, and we already have a short EURUSD position. Adding a long USDCHF trade here would in effect double our exposure to the same trade, so we will stand aside.
Confirm your chart-based trade setups with the Technical Analyzer. New to FX? Start Here!
Daily Chart - Created Using FXCM Marketscope 2.0
--- Written by Ilya Spivak, Currency Strategist for DailyFX.com
original source


