Talking Points:
-USD/CAD Technical Strategy: On Watch for Strength > 21-DMA at 1.3008
-Trader Sentiment Warns a Move Lower Could Still Be In The Works
-Looking For Clear Short-Term USD/CAD Levels Updating In Real-Time? Check Out GSI
Quick Fundamental Take:
The Canadian Dollar has had a rough week against the US Dollar and overall has found a patch of weak data. Recently, we’ve seen the price of the Canadian Dollar break from the price of Crude Oil, which historically held a strong positive correlation.
The weakness of fundamental data in Canada has steadily underperformed economists expectations since late April as shown via the Economic Surprise Index for Canada. The Citi Economic Surprise Index for the Canadian Economy recently showed its worst reading, meaning consistent underperformance, since January when the price of USD/CAD was in the mid-1.4000s. Much of the recent Canadian Dollar stability has had more to do with the subdued US Dollar more so than Canadian Dollar strength.
Access Our Free Q3 Dollar Outlook As The US Dollar Reserve Status Makes It A Possible Haven
The price of the Canadian Dollar vs. the US Dollar will likely be volatile heading into the end of the year. While the correlation has been weaker than historical averages, a price breakout in the Crude Oil market would support the Canadian Dollar or a persistently dovish Fed about market expectations could continue to drag the down USD/CAD.
To get a feel for where we stand, and where we could be heading, let’s go to the charts:
Technical Focus:
Interested In Learning the Traits of FXCM’s Successful Traders? If So, Click Here
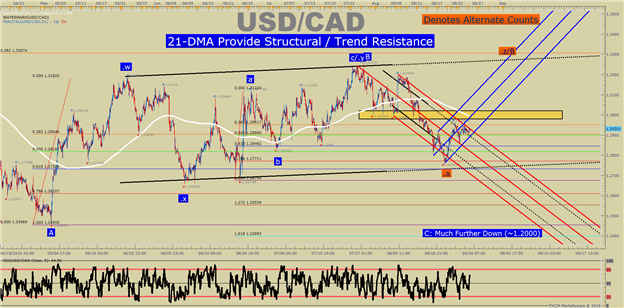
The chart above is a good explanation on the difference between a price and time correction. The move from late January to early May was a classic and strong price correction. In shortorder, the price of USD/CAD dropped ~15% in a bit more than four months, which many felt was a long-overdue move given the recent rally and other attributed more to the strong move higher in Oil.
Having a Hard Time Trading USD/CAD? This May Be Why
However, since May, we’ve seen the price of USD/CAD move sideways. What catches my attention is that such a sideways move or consolidation tends to be a sign that the prior move / trend, which was lower is not down. If that’s the case, we should identify points that would help validate a strong down move as well as resistance that if broken, would invalidate a short-term focus on the downside.
Resistance looks to be firm at ~1.3000. Specifically, 1.3008 marks the 21-DMA, and there is a lot of structural support at the 1.3000 zone. If price breaks above 1.3000/08, it appears there is little resistance until we see a retest at the top of the channel at ~1.3200. Such a move above 1.3000/08 would nullify my short-term focus on the downside, and could, in fact, be a prelude to a new multi-month high.
Regarding support to break, I would like to see a break below the August low before getting excited that the late-January to early-May trend could resume lower. The August low at 1.2762 would likely only break on a strong market shift in the US Dollar or a return to economic resilience in the Canadian Economy that may or may not be helped with a move higher in the price of Crude Oil.
Bottom Line:
Given the sideways price action, the price brackets I am watching is 1.3008 and 1.2762. A break of either would turn my medium-term outlook toward the direction of the break.
See How FXCM’s Live Clients Are Positioned in FX & Equities Here
It appears now that focus should be if we’re about to move into another phase of a price correction similar, albeit likely weaker than the January-May move. A break below the H2 2016 Macro Opening Range Low of 1.2840 would be the first indication that this move could be under way.
Canadian Dollar Has Regained Favorper Sentiment
USD/CAD Speculative Sentiment Index as of Thursday, August 25, 2016
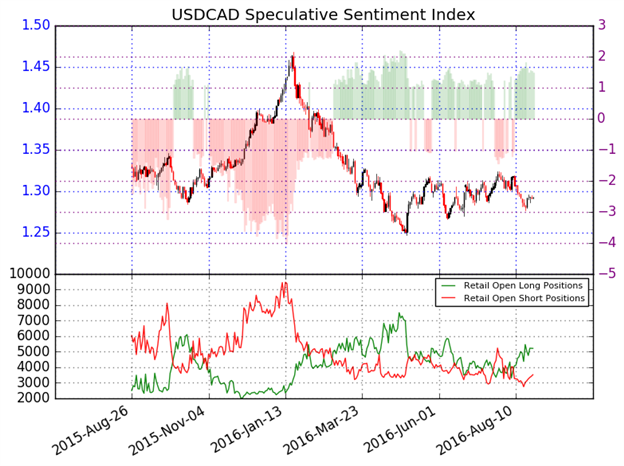
Combining the technical picture above, with the sentiment picture, and the Intermarket analysis, there continues to be evidence for a possible breakdown if USD/CAD can break below 1.2762.
The ratio of long to short positions in the USDCAD stands at 1.48 as 60% of traders are long. Yesterday the ratio was 1.52; 60% of open positions were long. Long positions are 0.6% higher than yesterday and 3.0% below levels seen last week. Short positions are 3.6% higher than yesterday and 18.0% above levels seen last week. Open interest is 1.8% higher than yesterday and 10.9% above its monthly average.
We use our SSI as a contrarian indicator to price action, and the fact that the majority of traders are long gives asignal that the USDCAD may continue lower. The trading crowd has grown less net-long from yesterday and last week. The combination of current sentiment and recent changes gives a further mixed trading bias.
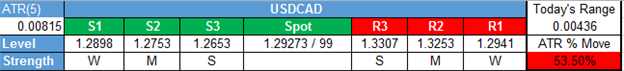
Key Levels as of Thursday, August 25, 2016
T.Y.
Showcase your trading skills against your peers in FXCM's $10,000 Monthly Challenge with a Mini Account.
original source


