Sign Up for a Free Yen Trading Guides Here
Talking Points:
- USD/JPY Technical Strategy: New 14-Month Lows Favor Selling Rips
- USD/JPY Broke Below Recent Low & Lower Highs Seen As Resistance
- JPY Returns to Strongest G10 Currency as Risk Sentiment Sours
As the Lunar New Year gets underway, we are seeing a gappy environment meeting souring sentiment. USDJPY and JPY crosses across the board turned sharply lower and a key support zone around the daily range of the December 2014 low, which has supported price multiple times, has now broken. This price move turns our attention back to the larger bearish view of the head and shoulder’s bearish reversal that could take us back to the 110-106 zone.
A Mirror Image of the Bottoming Process?
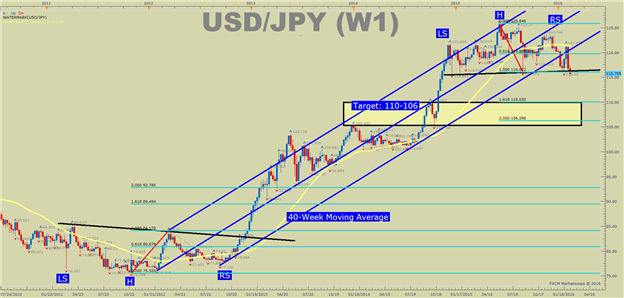
The chart above shows the similarity of the bottoming process in 2011/12 and the potential topping process over 2014-2015. The 40-WMA shows a recent pivot off the price after the USDJPY had its largest one-day gain in over a year after the Bank of Japan cut interest rates to -0.1%.
To see how FXCM traders are positioned, click here.
Given the turn lower of USD/JPY off the 40-WMA (same as 200-DMA as you will see on the chart below), and the pattern that is common at market turns, a move lower could be very aggressive. At the start of February, the market has effectively priced out a favorable probability until February 2017. Therefore, the US Dollar has seen some wind taken out of its sails, but the JPY could continue to strengthen should the downside momentum gather steam as investors’ price in more and more bad news.
February Favoring Further USD/JPY Downside?
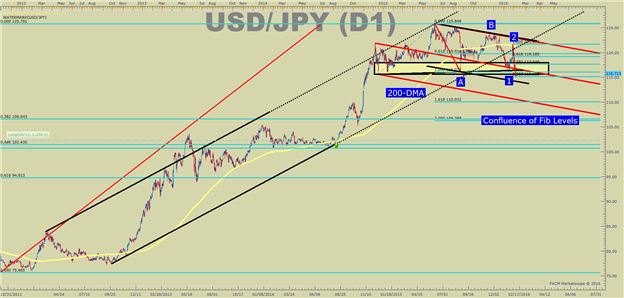
The chart above shows an effective price channel that is drawn off key pivots at the begging of this 4-year rally off the bullish head & shoulders pattern that has done a fair job of framing price action. You can see from above that after the price has broken below channel support, price popped higher on the BoJ negative rate announcement, only to treat prior support as likely new resistance.
The chart above shows a likely turning sequence that is just gaining momentum to the downside. Today’s break to 14-month lows opens up the question of where resistance might be found for USD/JPY bears to look to join for a new downside run with a better risk: reward.
Given the recent drop from late January to this morning, traders looking for a retracement should focus on the zone comprised of the 38.2-61.8% retracement for entering with less potential risk than entering on an extension. The zone goes from 117.65 up to 119.185.
On the downside, the targets of 110 & 106 align with a 61.8% move in the direction of the bearish head & shoulder’s move and a 100%, and more common target respectively. What is fascinating about the latter target is that the 106.60 level aligns with the 38.2% Fibonacci retracement of the 2011-2015 range.
If we see a reversal or medium-term retracement in USD/JPY, the 38.2% is often a minimum target. The fact that the 106 zone combines with the head and shoulder’s target heightens the probability that we could see 106 hit if JPY were to strengthen on an aggressive risk-off move for the rest of Q1 2016.
T.Y.
Interested In Learning the Traits of FXCM’s Successful Traders? If So, Click Here
original source


