To See How FXCM’s Live Clients Are Positioned In FX & Equities Click Here Now
Talking Points:
- USD/JPY Technical Strategy: Pushing Off Of Strong Resistance, Still Like Upside Break
- JPY Falling From Strongest G10 Currency. JPY Bearish Sentiment May Pick Up If Risk Does Too
- US Dollar Rebound Shows Bearish Sentiment May Have Gone Too Far
Unevenly Distributed Dollar Strength Has JPY Weakness In Question
USD/JPY has moved cleanly lower from the 110.50, which aligns with a multitude of resistance that we’ll unpack later. Over the weekend events, which included the G-7 meeting and Japan’s Trade Surplus that swelled unexpectedly to the largest amount since 2010 when the JPY was in an environment of persistence strength. The economic surprise brought short-term JPY strength, but that may not be long lasting.
Many had discounted the probability of BoJ intervention ahead of the G-7 Summit last weekend that Japan hosted. However, now that the G-7 meeting is in the rearview mirror, many traders think that all bets are off, and we could see renewed vigor from the BoJ to not let JPY buyers enjoy their JPY strength for as long as they have. The other possible scenario is renewed US Dollar strength on the back of renewed belief that the Fed will hike rates, and set the Dollar off on a path of policy divergence of other currencies.
Compete to Win Cash Prizes With Your FXCM Mini Account, Click Here For More Info
The problem with the above scenarios is that they’re potential scenarios at best. Policy makers in the United States & Japan have mentioned their intentions. However, so far they have been long on words and short on actions of late. In times like this, it’s helpful to look at the charts.
USD/JPY Has Run Into Strong Ichimoku Cloud Resistance
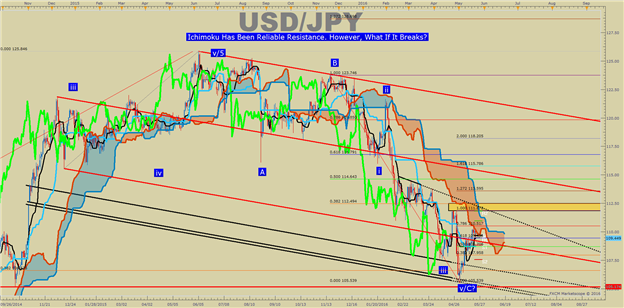
On the chart above, you’ll notice we’ve found long-term bearish resistance. The different technical tools and indicators that met price at near 110.50 were (listed in order of Importance) the Daily Ichimoku Cloud, the 55-DMA, and the 78.6% Fibonacci Retracement of the late-April to May Range.
If the fundamental story plays out even half-as-well as it could, with either the BoJ easing or Fed hiking beyond what is currently priced, I like the former scenario more of the two; we could see a move through resistance mentioned below that could make USD/JPY longs jump for joy this summer.
Additionally, the recent high may (not a trade recommendation) be an ideal spot for a stop and reverse if someone is currently holding short-exposure on USD/JPY. As mentioned earlier, the scenario that favors upside based on Central Bank action is reliant on a few scenarios playing and therefore, someone may prefer holding short-exposure, and the major equity markets may look like they’re about to collapse before they rocket higher. However, if we do break through these resistance levels, holding short USD/JPY would be ill advised and flipping on the trade may allow you to participate in a move that might resemble some of the previous breakouts.
A Sustained Break Above 110.578 Could Open a Strong Case for USD/JPY Bulls Everywhere
Key USD/JPY Technical Levels:
For those familiar with Elliott Wave Trend and Cycle Analysis, the move off the 105.53 low looks distinctly impulsive. Initial impulse waves have been labeled on the chart above, and the recent short-term top at 110.57 (a 500+ pip move), could be either the completion of an ‘a’ or ‘1’-wave in a more bullish scenario.
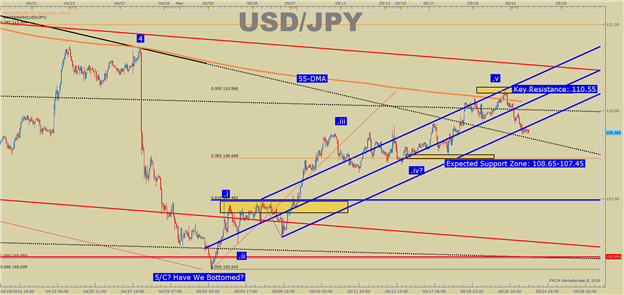
Given that a completed fives waves of a smaller degree wave have been labeled on the chart above, we should be on the lookout for a corrective move that now appears to be underway as we’ve fallen ~130 pips from last week’s high. Given the move higher, there is a distinct zone that I’d be watching for a corrective (higher-low) and that is between 38.2-61.8% of the move off 105.54. This zone encompasses 108.65-107.45 (peak of wave ‘i’) and 61.8% of the move higher.
If we can limit downside to these levels and then turn through the heavy zone of resistance that includes the Ichimoku Cloud, 55-DMA & the 78.6% Fibonacci Retracement, we may be about to embark on one of the largest USD/JPY rallies in over a year.
Therefore, the short-term view is bearish, as we haven’t entered the corrective zone yet. However, within the corrective zone, I’ll be looking for a turnaround, and subsequently watching for a break of 110.57 to get bullish. Naturally, a break below 105.539 would change the current bullish view and more than likely would be the result of either a ‘Brexit’ or a larger risk-on event grabbing the market’s attention.
USD/JPY SentimentShould Be on Watch Of Resistance Holding
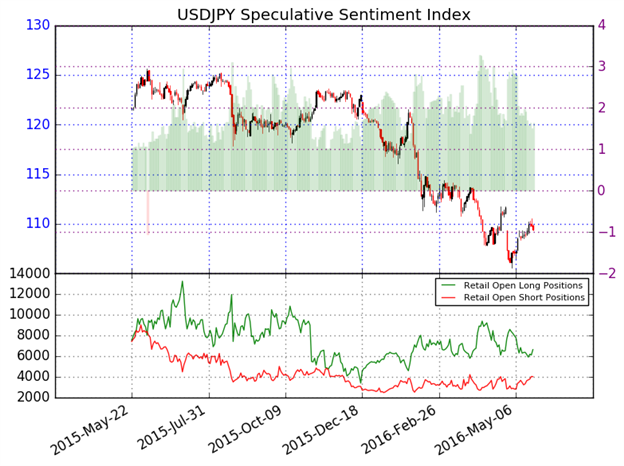
As of mid-day Monday, the ratio of long to short positions in the USDJPY stands at 1.64, as 62% of traders are long. Long positions are 12.5% higher than yesterday and 3.5% above levels seen last week. Short positions are 18.7% above levels seen last week. Open interest is 6.7% higher than yesterday and 3.4% above its monthly average. We use our SSI as a contrarian indicator to price action, and the fact that the majority of traders are long gives a signal that the USDJPY may continue lower. The trading crowd has grown further net-long from yesterday but moderated since last week.
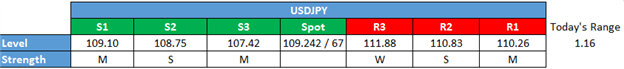
Shorter-Term USD/JPY Technical Levels
For those interested in shorter-term levels of focus than the ones above, these levels signal important potential pivot levels over the next 48-hours.
original source


