To See How FXCM’s Live Clients Are Positioned In FX & Equities Click Here Now
Talking Points:
- USD/JPY Technical Strategy: 3-Week Highs Turn Focus To Late-April Resistance
- JPY Remains Strongest G10 Currency. JPY Bearish Sentiment at Caution
- US Dollar Rebound Shows Bearish Sentiment May Have Gone Too Far
Unevenly Distributed Dollar Strength Has JPY Weakness In Question
In a hurry, USD/JPY has moved higher by ~400+ pips from strong support near the October 2014 low toward the 55-DMA and a trendline connecting the February and April highs. Now, with the FOMC minutes, many traders are looking for follow through from recent comments by BoJ member Taro Aso, who said the [BoJ is] keeping an eye current JPY strength.
Many had discounted the probability of BoJ intervention ahead of the G-7 Summit this weekend that Japan is hosting. However, after the G-7 meeting is in the rearview mirror, many traders think that all bets are off, and we could see renewed vigor from the BoJ to not let JPY buyers enjoy their JPY strength for as long as they have.
Compete to Win Cash Prizes With Your FXCM Mini Account, Click Here For More Info
In addition to the risk of QQE Expansion by the BoJ, it’s worth noting that the Federal Reserve finds themselves in a precarious position. For the first time, in a long time, the Fed appears to be ahead of the market in their views of interest rate hike probabilities, and recently Fed-Presidents Dennis Lockhart and John Williams have taken to recent speeches warnings about the market underpricing the probability of 2-rate hikes this year.
Therefore, it’s possible that we’re finding ourselves in the situation many trend traders have been wanting all along but have long been held without. Namely, we could be entering an environment where the Fed starts to push the market and the US Dollar higher at a time where the BoJ starts to push the JPY lower. If that happens, my view is that we should eat, drink, and be merry as long as we’re buying USD/JPY.
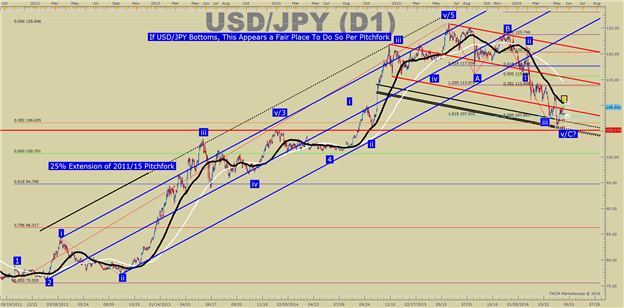
On the chart above, you’ll notice we’ve found long-term bearish channel support off the recent pivot low. If the fundamental story plays out even half-as-well as it could, with either the BoJ easing or Fed surprisingly hiking, we could see a move to resistance levels mentioned below that could make USD/JPY longs jump for joy this summer.
A Sustained Break Above the 55-DMA Could Open a Strong Case for USD/JPY Bulls Everywhere
Key Technical Levels:
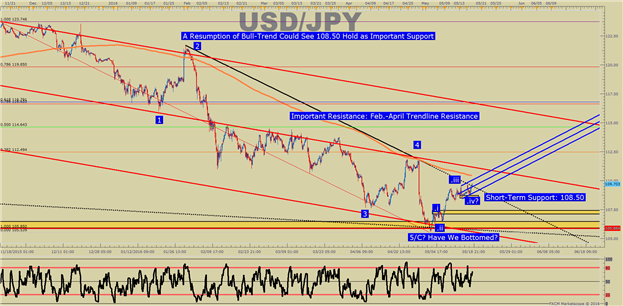
After rocketing higher at the start of May, we pondered what would come after hitting the Head & Shoulder’s target. For the last handful of trading days, USD/JPY has ranged within the 108-110 range. However, as noted above and soon to be argued below, there could be support setting up for further upside to develop.
First, it’s important to look at resistance because the US Dollar has been strong at a time the JPY has been relatively weak across the board, although not as weak as some commodity currencies. If the ‘big kahuna’ of a move that many institutional and retail speculators are hoping for to take us back to 120+, we’ll first need to address the 55-day moving average at 110.45 and the late-April high of 111.88. Given the sharp drop induced by a no-decision from the BoJ on April 28, an ability to take out that level on a move higher could understandably encourage the Bulls. 111.88 also aligns with the median line of the channel that has maintained the prices reasonably well since November. If we’re able to gain traction above this level, we’ll turn focus toward 112.50, the 38.2% retracement of the November-May range and 114.643, the 50% retracement of the November-May range.
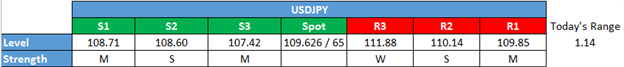
Support is easier to define thanks to recent price action. The opening range low at 108.50 would need to see a break and close below to encourage the bears. Until that level is broken, there appears to be too much momentum in favor of the upside. Below 108.50, the original resistance off the move higher near 107.35 would ideally hold if we’re seeing an aggressive, but not trend-breaking retracement. Below 107.35, traders would understandably need to brace themselves for a retest of the 2016 low of 105.54 or much lower.
USD/JPY Sentiment Should Be on Watch As Long Exposure Keeps Falling
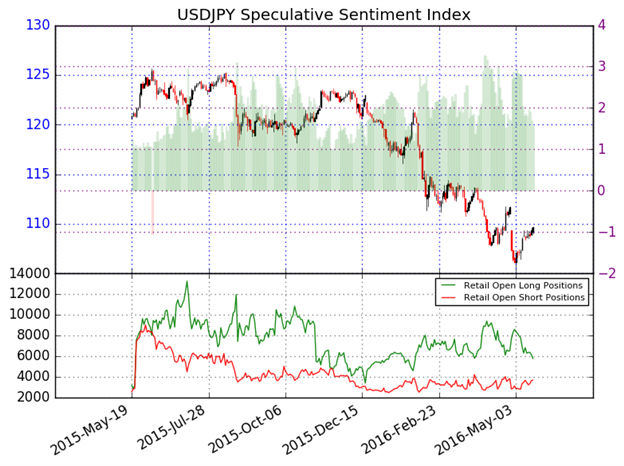
As of mid-day Monday, the ratio of long to short positions in the USDJPY stands at 1.58, as 61% of traders are long. Long positions are 7.2% lower than yesterday and 10.3% below levels seen last week. Short positions are 7.9% higher than yesterday. We use our SSI as a contrarian indicator to price action, and the fact that the majority of traders are long gives signal that the USDJPY may continue lower.
Shorter-Term USD/JPY Technical Levels
For those interested in shorter-term levels of focus than the ones above, these levels signal important potential pivot levels over the next 48-hours.
original source


