To See How FXCM’s Live Clients Are Positioned In FX & Equities Click Here Now
Talking Points:
- USD/JPY Technical Strategy: 14-Month Lows Favor Selling Strength
- Head & Shoulder’s Pattern Targets ~106.30
- Bank of Japan May Hold Off On Easing, Further Propelling JPY Strength
- USD ownership profile returns to June 2013 level
Technical Overview:
USDJPY is currently sitting on very thin, albeit important support. From here, it appears as though an inability for USD/JPY to hold these levels could bring about a drop to the 107-105, which aligns with a recent Analyst Pick. For 2016, the current zone of 110-111 have been appropriate levels to be on the lookout for holding and so far, they have. If, however, we fail to hold then another 300-500 pip drop shouldn’t be ruled out regardless of Abenomics intentions
Fundamental Story:
While the US dollar has shown some signs of life relative to commodity currencies at the start of April, the strength of the JPY continues to be a dominant theme. For much of 2016, JPY strength has aligned with a consistent push lower in mid-to-long end sovereign yields. Currently, German and US-10yr Debt is yielding their lowest levels in 3-months.
Understandably, the recent JPY strength may be leaving traders wondering why there has been little intervention given such yen strength. This is an appropriate question to ask, but it may be helpful to understand that Japan is hosting the G7 in May. Therefore, blatant intervention may be doubtful, as it would put other countries in the G7 at a distinct competitive disadvantage.
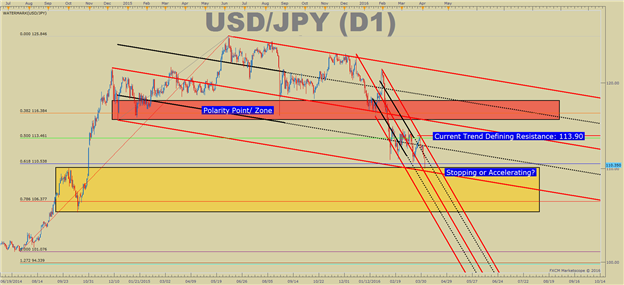
One of the first bearish patterns to emerge on the USD/JPY chart was the bearish head & shoulders. The trigger for that to break was 116/115.55. Since we broke through that level, if feels as though USD/JPY hasn’t looked back.
The first target we looked at was the 110 zone that has currently acted as support. Below there, the traditional target was around 106.30. This turns our attention to the zone of 107-105 on the break. A break below this zone will turn attention to the previously unthinkable, and likely still a contentious level of 101.50 (July 2014 low), and the psychologically critical 100 level.
From Frustration To Pain
USD/JPY traders have been trained to buy on dips and over the last five years have been rewarded on this training. The frustration came from the initial drop of a correction that was followed by most of months of consolidation before a move higher. Now, the consolidation appears to take place before a larger drop, which could the behavioral change, is underway. Such a behavioral change would likely lead to pain given the sentiment readings shown below.
Either way, there is very clear resistance at 113.90 and 115.55. The former is the recent pivot on the last day of March, and the latter is the December 2014 low that has acted as a polarity level on the chart for 17-months. As noted above, letter support remains in the 107 – 105 zone. While the 13% drop has been aggressive recent price action since Abenomics was introduced, a longer trend look will show you that JPY strength could be a near pointless fight once the larger forces take over.
Despite the intentions of Kuroda & Co.
Sentiment Favors Further JPY Strength as Retail Fights The Trend
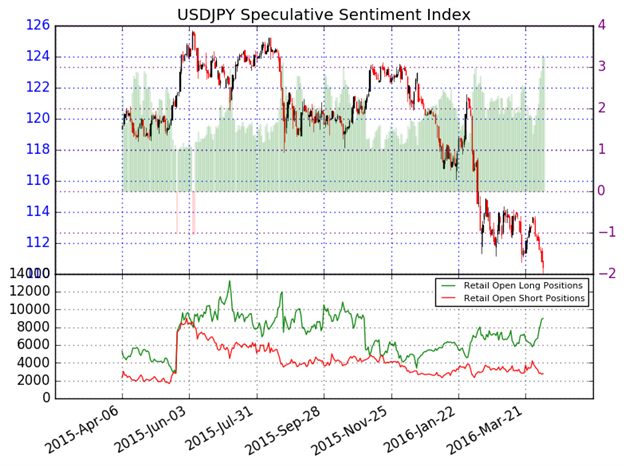
The ratio of long to short positions in the USDJPY stands at 3.34, as 77% of traders are long. Yesterday the ratio was 3.17; 76% of open positions were long. Long positions are 5.9% higher than yesterday and 47.1% above levels seen last week. Short positions are 0.5% higher than yesterday and 27.7% below levels seen last week. Open interest is 4.6% higher than yesterday and 18.1% above its monthly average. We use our SSI as a contrarian indicator to price action, and the fact that the majority of traders are long gives signal that the USDJPY may continue lower. The trading crowd has grown further net-long from yesterday and last week. The combination of current sentiment and recent changes gives a further bearish trading bias.
original source


