To receive Tyler’s analysis directly via email, please SIGN UP HERE
Talking Points:
- Crude Oil Technical Strategy: Favoring Downside < $44.62/bbl
- Intermarket Analysis Shows US Dollar Within A Whisper Of A Breakout
- Sentimental Trading System Weekly Long Exposure Increased ~244%
Access Our Free Q3 Oil Outlook As Oil's Best Quarter Looks For Confirmation
The price of WTI Crude Oil (CFD: USOil) traded at its lowest levels in three months this week as the Crude rally looks less sustainable than the equity rally that recently saw the SPX500 reach lifetime highs this month. A few weeks ago, we shared a new data point that helped forecast the price decline that has developed:
Recent reports show the short-term floating storage is sitting (pun intended) at its highest level since 2009 per the IEA July Oil Market Report. Bloomberg recently noted that ~9 million barrels of crude were stored off the coast of the North Sea in the UK, which was a significant jump of ~7 million barrels in May.
For what it’s worth, as I was flying into Houston Airport on July 22, I was amazed at the Oil Tanker’s sitting offshore. While I do not fly into Houston regularly, it does add to the report’s credibility, as it seemed a tanker could not turn around without running into other tankers in the Gulf of Mexico.
Track short-term Crude Oil price levels and patterns with the GSI indicator!
For this reason, we have encouraged you to keep an eye on increasing supply in H2 2016, and whether or not supply will be met with sufficient demand. As we head into the close of July, Crude Oil price is down ~20% from the June peak, and seasonal supply per the EIA report is at its highest in at least two decades.
That being said, we appear to be seeing a new wave of supply coming onto the market, and if demand cannot keep up (which the storage on Oil tankers argues it cannot), we could move lower. To explain how much lower, let’s move on to the charts.
Crude Oil Price Chart Shows Little Support & Strong Downward Momentum Is Building
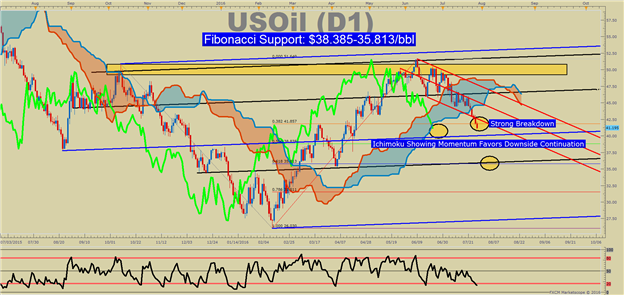
Few things are going right for Crude Oil Bulls when looking at the price chart. We’re seeing buyers fail to come in and support the price that nearly doubled from ~$26/bbl in February to ~$51/bbl in June. We’ve recently seen a breakdown through the 38.2% Fibonacci retracement level of the February-June range at $41.85/bbl, and a further breakdown is favored when looking at Ichimoku Cloud.
Ichimoku Cloud is a trend following indicator that allows you to see the “big-picture trend” on the chart. If price (shown via candles), and the momentum line (bright green on my chart) are below the cloud, we are in a bearish environment. Buying against the momentum and trend is not advised because a downtrend tends to gather steam much like a snowball rolling down a mountain.
For now, we can use the bottom of the cloud, which aligns with the 100-DMA at $44.63/bbl as clear resistance. Until price breaks above this level on a closing basis, higher prices should be viewed as more favorable levels to enter a short position as opposed to “buying low.”
Significant support aligns at the 61.8% Fibonacci Retracement zone of the February-June zone, which is also the late-March low ~$35.81/bbl. While fighting a trend is not encouraged, that is a level to see if buyers begin to show up due to bargain prices.
A failure for this level to hold will put the pit back in the stomach of Oil producers, as they will likely wonder if we are yet to see the low of this Millennium to date.
Bottom Line:
The pullback we have seen is not surprising, but unfortunately, the evidence is building that we could see downside acceleration. Furthermore, now that we have broken below the 100-DMA, a stronger break toward the next key support of 50% of the February-June range at $38.835/bbl could be underway.
For now, be on the watch for further US Dollar strength that would continue to pressure the price of Oil down through the 38.2%-61.8% retracement zone of the February-June rally.
Contrarian System Warns of Further Downside As of 7/28/16
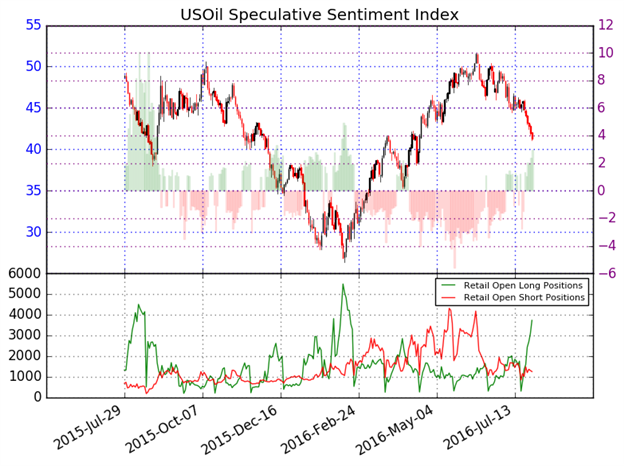
In addition to the technical focus around multiple support-zones, we should keep an eye on retail sentiment. Further downside is currently aligned with our Speculative Sentiment Index or SSI for now.
As of mid-day Thursday, The ratio of long to short positions in the USOil stands at 2.98, as 75% of traders are long. Long positions are 21.8% higher than yesterday and 244.2% above levels seen last week. Short positions are 1.5% lower than yesterday and 17.6% above levels seen last week. Open interest is 15.0% higher than yesterday and 58.6% above its monthly average.
We use our SSI as a contrarian indicator to price action, and the fact that the majority of traders are long gives a signal that the USOil may continue lower. The trading crowd has grown further net-long from yesterday and last week. The combination of current sentiment and recent changes gives a further bearish trading bias.
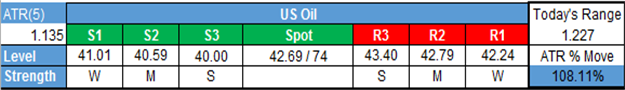
Key Levels Over the Next 48-hrs of Trading As of Monday, July 14, 2016
T.Y.
Think Oil has more room to run? Trade Oil With Low Margin Requirements (non-US Residents only)
original source


