Daily
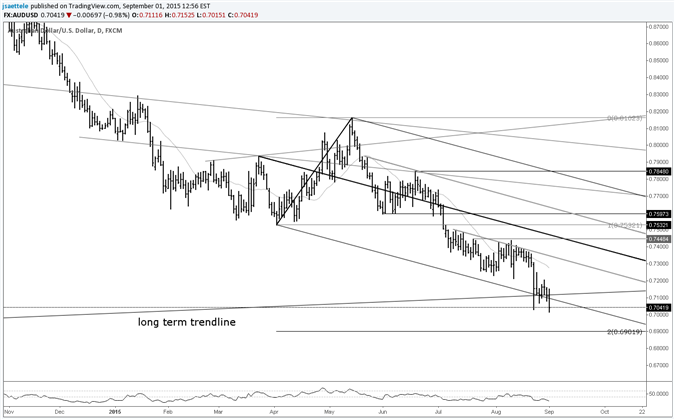
Chart Prepared by Jamie Saettele, CMT
Automate trades with Mirror Trader and see ideas on other USD crosses
-“June’s AUDUSD range (3.4%) was the smallest monthly range since October (3.05%). In fact, the intermonth plots of price action for June and October are virtually identical. Both time series form 3 wave corrective (A-B-C) patterns.”
-“Focus remains lower towards .7100/50. A close above .7450 is needed in order to indicate a reversal.” AUDUSD is now below the long term trendline (2001-2008 lows). The next big level of interest on the downside probably isn’t until the 1999 high and 2004 low at .6747/71. .7205 is now the pivot (previously .7450).
For more analysis and trade setups (exact entry and exit), visit SB Trade Desk
original source


