To receive Ilya's analysis directly via email, please SIGN UP HERE
Talking Points:
- AUD/USD Technical Strategy: Flat
- Support:0.9301, 0.9277, 0.9263
- Resistance: 0.9340, 0.9371, 0.9403
The Australian Dollar advanced as expected against its US counterpart, confirming the formation of a Falling Wedge chart pattern. Near-term resistance is at 0.9340, the 38.2% Fibonacci retracement, with a break above that on a daily closing basis exposing the 50% level at 0.9371. Alternatively, a reversal below the 23.6% Fib at 0.9301 clears the way for a test of the 14.6% level at 0.9277.
We are tactically opting not to pursue a long position as topping cues in the S&P 500 warn of oncoming risk aversion that may sink the sentiment-sensitive Australian unit. Indeed, the correlation between the stock index and AUD/USD is now 0.71 (on rolling 20-day studies).
Add these technical levels directly to your charts with our Support/Resistance Wizard app!
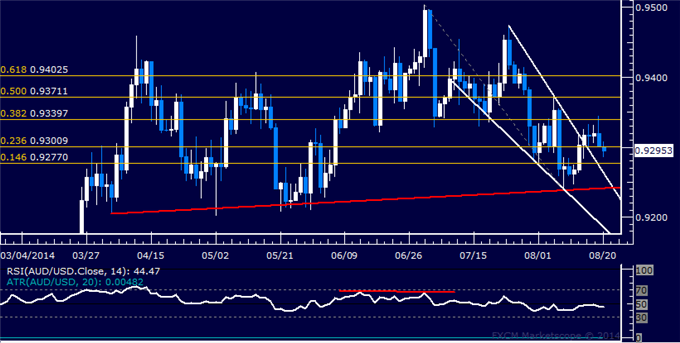
Daily Chart - Created Using FXCM Marketscope 2.0
--- Written by Ilya Spivak, Currency Strategist for DailyFX.com
original source


