Talking Points
- GBP/USD Technical Strategy: Longs Preferred
- Further gains possible in absence of bearish signal
- Dojis on the daily and four hour charts hint at a bounce
As noted in yesterday’s candlesticks report, GBP/USD was poised for further gains following a Doji formation on the daily. The candlestick signaled a return of the bulls following a test of critical support near 1.6660/2. With a bearish reversal signal missing on the daily, the pair may be in store for further gains, with sellers likely to emerge at the November 2009 high near 1.6870.
GBP/USD: Set For Further Gains
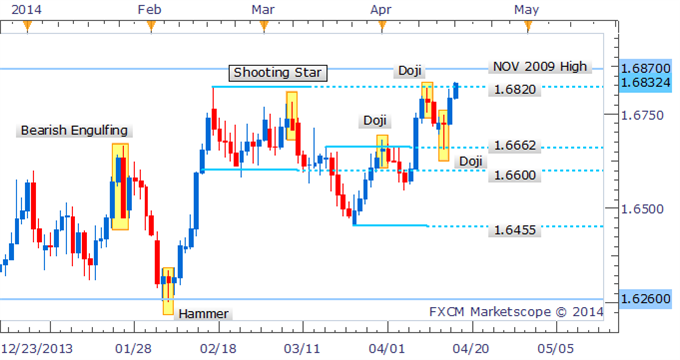
Daily Chart - Created Using FXCM Marketscope 2.0
Examining intraday price action using the four hour chart; the Dragonfly Doji near 1.6660/80 signaled a lack of conviction amongst bears to push prices lower. With the Pound now probing above the 1.6815 mark in early European trading with a bearish signal absent, further gains over the remainder of the week look possible.
GBP/USD: Dragonfly Doji Highlights Hesitation From The Bears
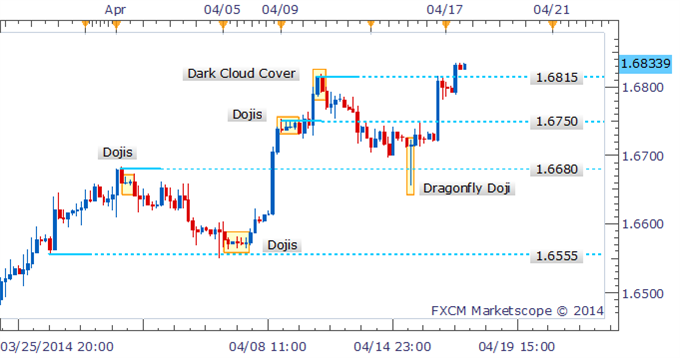
4 Hour Chart - Created Using FXCM Marketscope 2.0
This week’s gains for the pound have acted to negate the Dark Cloud Cover formation that had appeared near multi-year resistance for GBP/USD. The rally has arisen following a Piercing Line pattern which signaled the bulls were returning to the Cable. 1.6770 remains a critical level of resistance for the GBP/USD, given it has failed to close above the mark since 2008.
GBP/USD: Bulls Return As Piercing Line Forms on Weekly
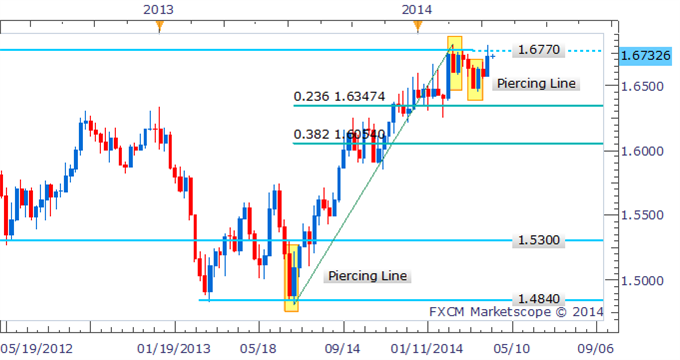
Weekly Chart - Created Using FXCM Marketscope 2.0
By David de Ferranti, Market Analyst, FXCM
Follow David on Twitter: @Davidde
To receive David’s analysis directly via email, please sign up here.
Learn how to read candlesticks to help identify trading opportunities with the DailyFX Candlesticks Video Course.
original source


