To receive Ilya's analysis directly via email, please SIGN UP HERE
Talking Points:
- GBP/USD Technical Strategy: Flat
- Support: 1.5447, 1.5213, 1.5024
- Resistance: 1.5591, 1.5741, 1.5825
The British Pound looks vulnerable to deeper losses against the US Dollar as sellers set their sights below the 1.55 figure. A daily close below the 23.6% Fibonacci expansion at 1.5447 exposes the 38.2% level at 1.5213. Alternatively, a turn above the 14.6% Fib at 1.5591 clears the way for a test of a falling trend line set from mid-July, now at 1.5741.
Risk/reward considerations argue against entering short with prices in close proximity to support. On the other hand, the absence of a defined bullish reversal signal suggests taking up the long side is premature. We will remain flat for now, waiting for a more actionable opportunity to present itself.
Add these technical levels directly to your charts with our Support/Resistance Wizard app!
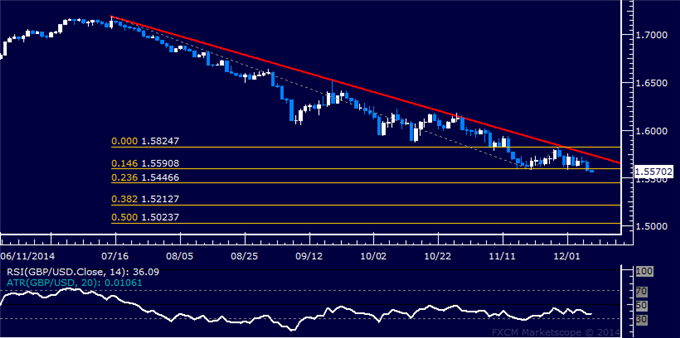
Daily Chart - Created Using FXCM Marketscope
--- Written by Ilya Spivak, Currency Strategist for DailyFX.com
original source


