To receive Ilya's analysis directly via email, please SIGN UP HERE
Talking Points:
- GBP/USD Technical Strategy: Short at 1.6233
- Support: 1.6043, 1.5931, 1.5749
- Resistance: 1.6183, 1.6237, 1.6459
The British Pound advanced against the US Dollar as expected after producing a bullish Piercing Line candlestick pattern. Near-term resistance is at 1.6183, the site of a falling trend line set from mid-July, with a break above that on a daily closing basis exposing the 23.6%Fibonacci retracement at 1.6237. Alternatively, a reversal below the 14.6% Fib expansion at 1.6043 clears the way for a challenge of the 23.6% threshold at 1.5931.
We sold GBPUSD at 1.6233 and have since taken profit on half of our exposure. The remainder of the trade is open to capture any further downside momentum. The stop-loss is now at the breakeven level (1.6233).
Add these technical levels directly to your charts with our Support/Resistance Wizard app!
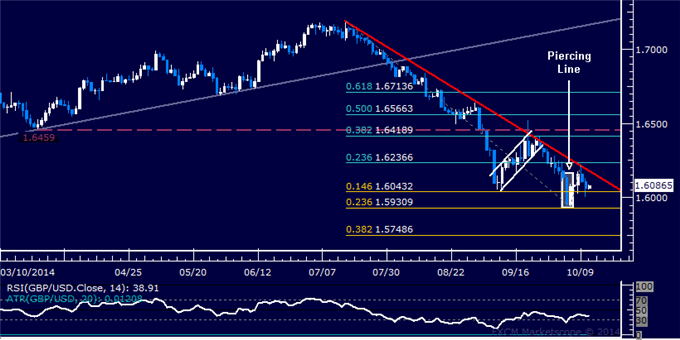
Daily Chart - Created Using FXCM Marketscope 2.0
--- Written by Ilya Spivak, Currency Strategist for DailyFX.com
original source


