To See How FXCM’s Live Clients Are Positioned In FX & Equities Click Here Now
Talking Points:
- US Dollar Technical Strategy: Resistance Holding, Downside Traction Unlikely
- Awaiting US Dollar To Overtake 12,001 Before New Exposure Added
- Pick Your Poison When Trading Individual USD Pairs?
What’s the best thing that could happen to the US Dollar? It’s a question that has no specific answer. However, in terms of what’s probable, I would venture to say that’s it would be the institutional shorts giving up on their US Dollar Bearish Bets (which were aggressive throughout May), and a warming up to the view that we’ll see multiple hikes by the Federal Reserve as one 2016 hike continues to get comfortable priced into the market.
When looking at credit markets, that might be coming to fruition.
In addition to the probability of a rate hike this summer jumping from less than 20% to above 50% (making it considered as ‘priced in’), risk assets haven’t sold off. While some components have been disappointing of the US Economy (which isn’t alone), there seems to be less likeliness of a Fed-induced shock should they hike this summer.
Compete to Win Cash Prizes With Your FXCM Mini Account, Click Here For More Info
As of Tuesday morning, US Data went from in-line to an ugly miss. The PCE was in-line alongside personal income, however, a string of late data points that included Consumer Confidence, Dallas Fed Manufacturing, and the Chicago Purchaser’s Index all missed economist’s expectations.
In and of itself, this wasn’t good.
However, at around 10:30 am EST, a new ICM Poll was released by Guardian that showed a phone poll (that had previously favored a remain vote), showed a leave vote pulling ahead. This caused a near-immediate GBP sell-off with EUR following suit, and US Dollar was near the day’s highs even with the data misses. As a reminder, the world of FX is almost always relative.
What Will The June Opening Range Breakout Bring FX Traders?
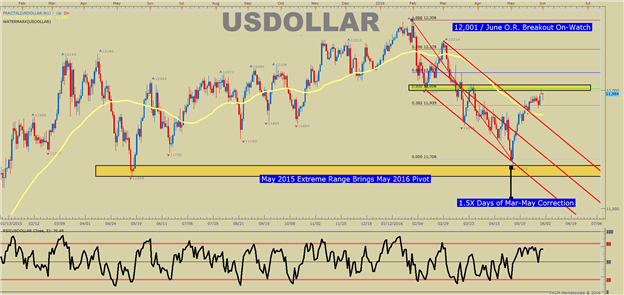
The above chart shows price data on the US Dollar Index over the last 18-months. Since then, we’ve seen an aggressive decline that put the US Dollar as one of the worst performing asset classes of 2016 at the end of April. However, since the beginning of 2015, the US Dollar is basically flat. While some may think this means the US Dollar has topped, consolidation can be a leading indicator of trend continuation.
If that’s the case, it pays to know what triggers could lead to a break higher to continue the trend.
For now, there is only one technical resistance worth alerting you to, and that is the 12,006/1, which was the February opening range low as well as a confluence of Fibonacci levels. On the chart, you’ll note the 55-DMA and the corrective price channel (red) has recently broken. Therefore, pull-backs toward channel resistance and the moving average (new support points), may better serve as buying opportunities.
The macro-picture mentioned above favors a more steady, yet resilient break above the 12,001/6 level to open the month of June. Should this happen, the US Dollar bears will be left with fewer and fewer arguments for a multi-year Dollar Downtrend they were so confident in developing during February-April.
Should a more significant breakdown develop, the ST support is currently the recent corrective pullback low of 11,921. Should the weekly low break, 55-DMA sits at 11,894 followed by 11,880, which is the 38.2% of the May Range, and should be the first focus of any true trend set-back.
The Dollar Is Strong But Pick Your Poison Wisely
The strong move in May that we warned about has shown up in force, and if 2015 is any guide, we could continue in this move for months. Now that the index is sitting at important resistance, of 12,001/6, it is hard to think we’ll move straight higher as we have since May 03 with the heavy data points like Non-Farm Payroll & the European Central Bank to open June.
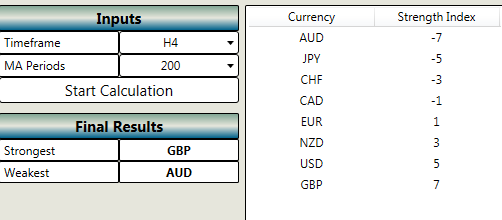
For those braver or more confident than most that the US Dollar breakout is in its embryonic stage, it may be helpful also to look at opportunities to buy USD vs. weaker currencies some of the commodity currencies or the JPY. Here is a relative strength measure from mid-morning on May 31, 2015:
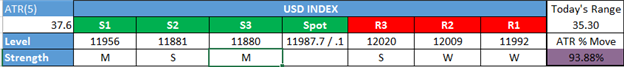
Shorter-Term US Dollar Technical Levels
For those interested in shorter-term levels of focus than the ones above, these levels signal important potential pivot levels over the next 48-hours.
Interested In our Analyst’s Longer-Term Dollar Outlook? Please sign up for our free dollar guide here.
T.Y.
original source


