- EURUSD rebounds from top of support zone
- GBPUSD biggest test of uptrend yet; rolling over?
- USDCAD at channel; great place for a low
--Subscribe to Jamie Saettele's distribution list in order to receive a free report to your inbox once a day.
--Tradingideas are availabletoJ.S. Trade Desk members.
EUR/USD
Weekly
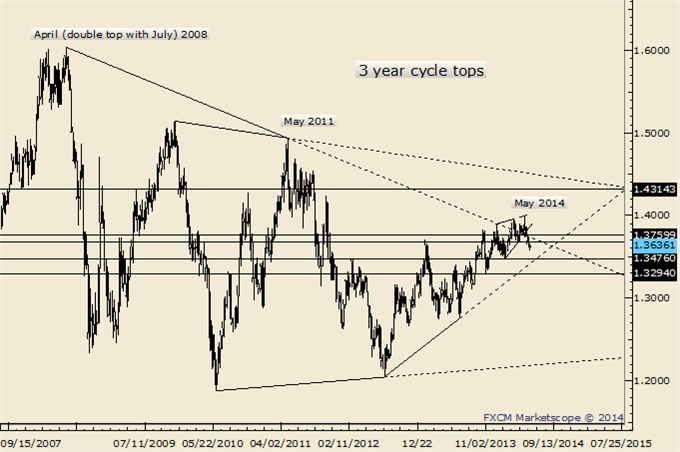
Chart Prepared by Jamie Saettele, CMT using Marketscope 2.0
Automate trades with Mirror Trader
-“The weak momentum profile is not suggestive of a strong bull.” Weekly momentum is just as telling. The most recent top is accompanied by RSI divergence with RSI < 60. This is exceptionally bearish. A similar RSI pattern occurred in July 2008. If the rate does trade to a new high, then a drop back into the range would be required in order to create a tradable high (complete an ending diagonal from 1.3294…highlighted). It’s worth mentioning that important tops have formed in April/May in recent years. A 1.3750 break would ‘announce’ that a downtrend has commenced.”
-EURUSD made a new high and the sharp reversal supports the ending diagonal (wedge) interpretation. Diagonals are often fully retraced (sometimes quickly), which yields a target of 1.3294. Recent developments put to rest the idea that EURUSD has broken the line that extends off of the 2008 and 2011 highs. Rather, a failed breakout and top would keep with the pattern of 3 year cycle tops. 1.3750 is an important reference point (year open) but 1.3722 is now important to the integrity of the near term downtrend.
-Near term, EURUSD has bounced from the top of a well-defined 1.3560/90 support zone. Friday’s rally stalled at former support (5/15 low) but respect potential for a bigger bounce next week.
GBP/USD
Weekly
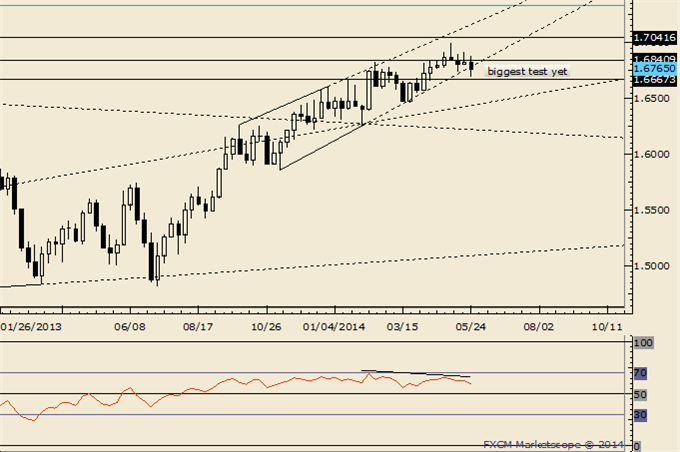
Chart Prepared by Jamie Saettele, CMT using Marketscope 2.0
Automate trades with Mirror Trader
-GBPUSD is showing signs of a top. The rally failed the week that ended 5/9 just above the August 5, 2009 close (high day for the entire move off of the 2009 low). The ensuing decline was sharp and found support at the line that extends off of the November, February, and March lows. That line broke this week (can be seen on the daily) and provides the best (not earliest) evidence yet of a broader shift.
AUD/USD
Weekly
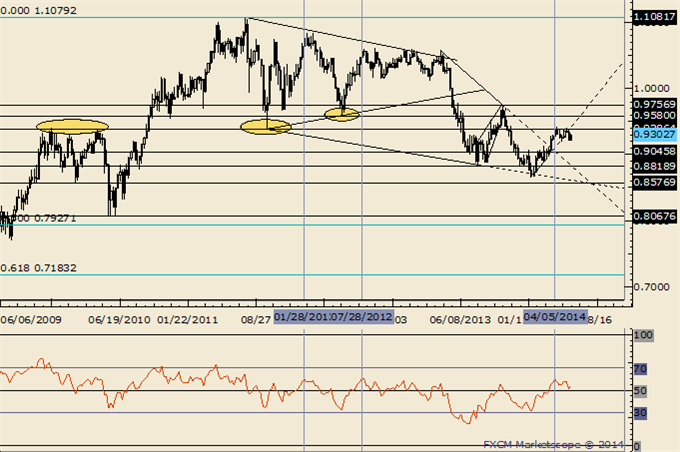
Chart Prepared by Jamie Saettele, CMT using Marketscope 2.0
Automate trades with Mirror Trader
-AUDUSD failed just above .9400 (and just shy of cited resistance at .9412/23) last week and saw its 2nd largest weekly decline of the year. Weekly RSI failed just above 60 in April and just below 60 last week. Since the 2011 top, each RSI failure near 60 has led to a top or topping process (range for several weeks then a breakdown...that appears to be the case now).
NZD/USD
Weekly
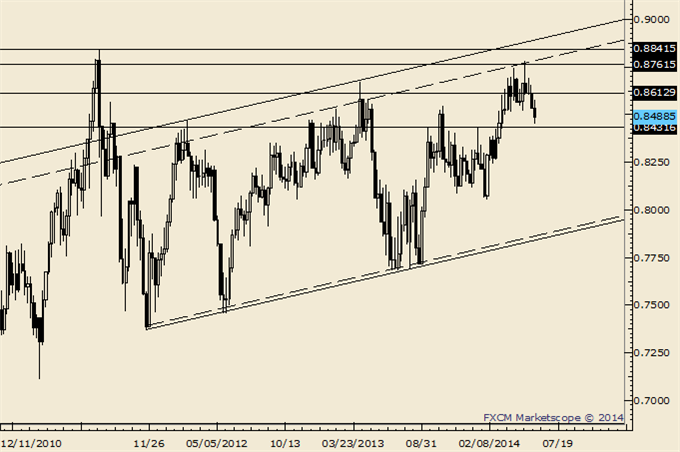
Chart Prepared by Jamie Saettele, CMT using Marketscope 2.0
Automate trades with Mirror Trader
-“Don’t forget about the line that extends off of the 1996 and 2007 highs. That line crosses through the 2008, 2011, and highs as well. In 2011 (record free float high), the rate surged through the line in late July before topping on August 1st.”
-After trading primarily between .8500 and .8700 for the last 6 weeks, NZDUSD topped right at the mentioned line from 1996. The top also came in just above the August 1, 2011 close (that was the day of the free float record). The weekly key reversal and follow through this week bolsters the idea that NZDUSD has topped. .8600 and just above is resistance.
USD/JPY
Weekly
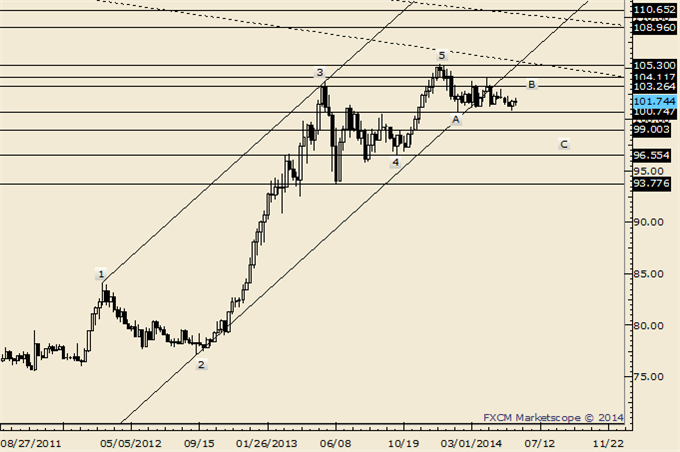
Chart Prepared by Jamie Saettele, CMT using Marketscope 2.0
Automate trades with Mirror Trader
-“USDJPY has bounced from the line that extends off of the February and 3/14 lows. The rally from the February low channels in a corrective manner and makes 104.12 important from a bigger picture bearish perspective.”
-“There is an Elliott case to be made for a return to the 4thwave of one less degree. The range spans 93.78 to 96.55. Of course, the path to get to that level is far from clear.” Near term, the failed run at the lows gives scope to additional ranging between 101.35 and 103.25.
USD/CAD
Weekly
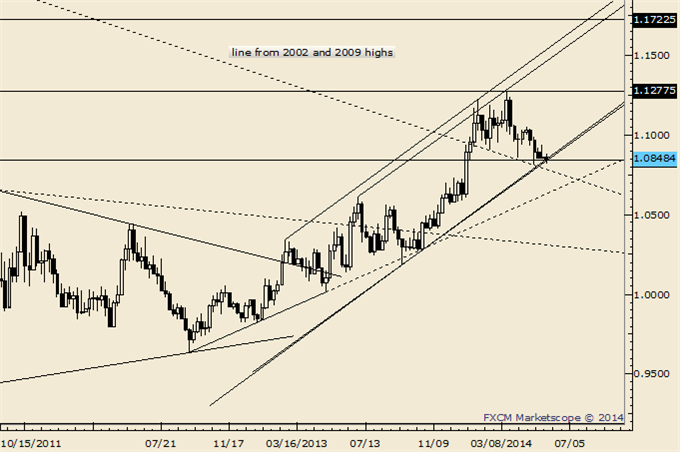
Chart Prepared by Jamie Saettele, CMT using Marketscope 2.0
Automate trades with Mirror Trader
-Measured objectives from the breakout above the 2011 high range from 1.1680 to 1.1910. The Jul 2009 high rests in this zone at 1.1724 and the 2007 high is near the top of the zone at 1.1875.
-From an Elliott perspective, it’s possible that the rally from the 2012 low composes a ‘3rd of a 3rd (or C)’ wave from the 2007 low.
-Action since the January high may compose a complex correction (triple zigzag in this case). The rate is hugging channel support…this is a good place for a turn higher.
USD/CHF
Weekly
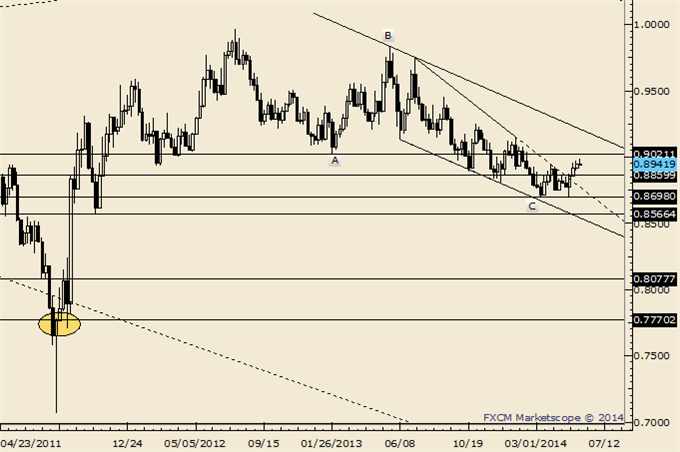
Chart Prepared by Jamie Saettele, CMT using Marketscope 2.0
Automate trades with Mirror Trader
-The same momentum considerations that apply to EURUSD apply to USDCHF (the March price low occurred with RSI above 30). Weekly RSI has been unable to register an ‘oversold’ reading despite the market declining for almost 2 years.
-“Patter wise, the decline from the 2012 high ‘fits’ well as a 3 wave correction with wave C as an ending diagonal. When (if) this market turns is up in the air.” Did we get our answer? USDCHF is above the line that extends off of the July 2013 and January 2014 highs. .8803 is important to the integrity of the reversal. Beware of resistance from the February 2013 low at .9020.
original source


