Talking Points:
- Potential Re-test of Broken Trend Line
- 2 Concurrent Signals on the 4-Hour Chart
- Rising Wedge Pattern in Play for GBP/AUD
It is rare for a double-top pattern to represent a potential entry point in forex—or in other markets, for that matter—as prices often overshoot the estimated turnaround area. Today's trade is no exception to that general rule, although this is as close to a double top as we’re likely to see in such choppy markets.
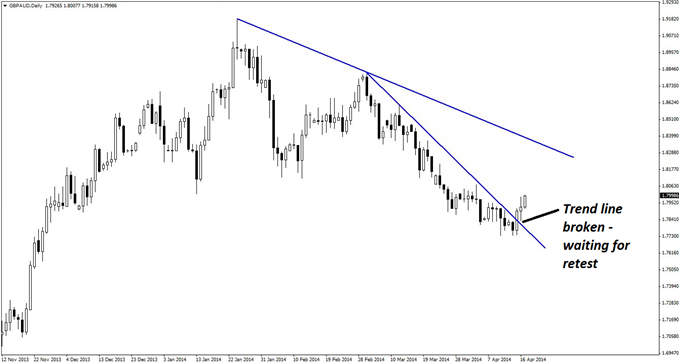
The story begins on the daily chart of GBPAUD, which is showing somewhat bearish momentum. A trend line was recently broken, but it has yet to be retested. That is a prime opportunity to look for a potential short set-up in order to hop on should the trend line break prove false and the move continue to the down side. Nonetheless, even a return to test the top of the broken trend line would quite easily produce a move in excess of 200 pips.
Guest Commentary: Daily Trend Line Break in GBP/AUD
As seen on the below four-hour chart, price has already hesitated once at a previous overhead resistance cluster, as marked. The pin bar that resulted on the four-hour chart did not result in a downward move, but it was sufficient evidence to support the continued presence of sellers in the area of the shaded blue box. Should price reverse from its current location, a double top (or as close to one as can be reasonably expected in forex) would be formed.
It is also worth noting that this short trade is actually in the direction of the daily trend, and not against it.
Guest Commentary: Key Resistance Zone for Selling GBP/AUD
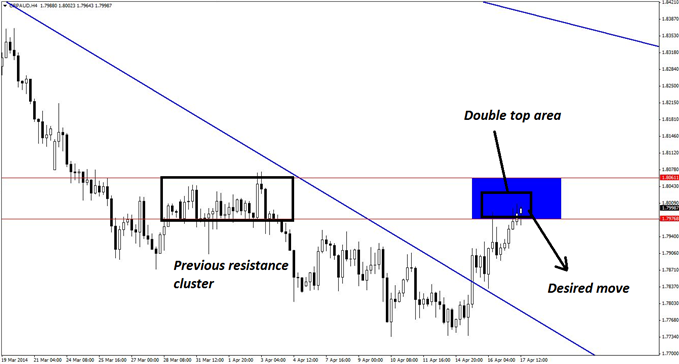
The estimated resistance zone is 1.7976-1.8061, an area that is 85 pips in depth and ultimately insufficient from a risk standpoint to justify taking this trade. As a result, a lower time frame will have to be employed in order to improve the ratio and find a viable trade trigger.
Things look rosier on the hourly chart below, where a wedge-type pattern has formed. Price is now creeping steadily along the lower boundary of the wedge, which is a sign of decreased momentum. It may well simply break down here, although it is equally possible that a retest of the highs or even a temporary spike past the top of the wedge may occur.
Guest Commentary: Rising Wedge on GBP/AUD Hourly Chart
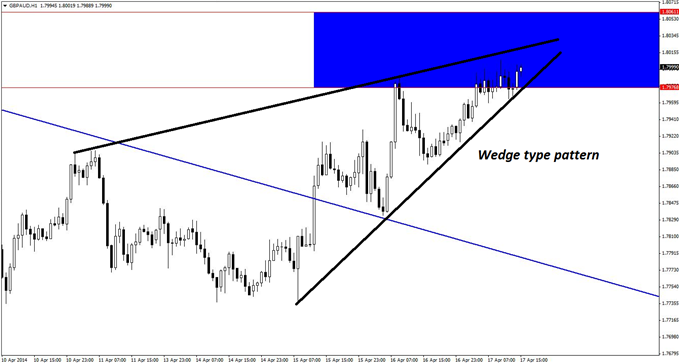
In all, the safest response is to hold off until at least a new high has been made, allowing for the potential occurrence of bearish reversal divergence in the process. Should such divergence not appear, pin bars and/or bearish engulfing candlestick patterns would also indicate viable short-entry opportunities, particularly if price made a last-minute momentum move.
The hourly time frame should provide a risk zone most likely in the 35- to 50-pip range, which is small enough to justify taking this trade. Nonetheless, two or three attempts may be required to successfully hop on to this move. One last item firmly in this trade's favor, however, is the fact that the four-hour chart is currently displaying six consecutive bullish bars, and reversion to the mean theory suggests that GBPAUD is now overdue for some bearish movement.
By Kaye Lee, private fund trader and head trader consultant, StraightTalkTrading.com
original source


