Talking Points:
- US Dollar Threatens Critical Rising Trend Line Support
- S&P 500 Coiling Up for a Breakout Below 2100 Figure
- Gold Awaits Direction Cues, Crude Oil at 5-Week High
Can’t access the Dow Jones FXCM US Dollar Index? Try the USD basket on Mirror Trader. **
US DOLLAR TECHNICAL ANALYSIS – Prices may be readying to turn lower after producing a bearish Evening Star candlestick pattern. Negative RSI divergence reinforces the case for a downside scenario. A daily close below the intersection of the 14.6% Fibonacci retracement and a rising trend line at 11734 exposes the 23.6% level at 11648. Alternatively, a reversal above the 11854-88 area marked by the March 2009 high and the 38.2% level opens the door for a challenge of the 50% Fib at 11983.
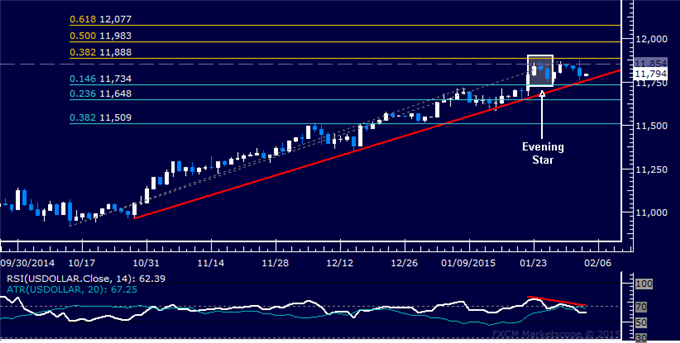
Daily Chart - Created Using FXCM Marketscope
** The Dow Jones FXCM US Dollar Index and the Mirror Trader USD basket are not the same product.
S&P 500 TECHNICAL ANALYSIS – Prices declined as expected after putting in a bearish Evening Star candlestick pattern. A daily close below the 23.6% Fibonacci retracement at 2028.00 exposes the 1980.60-88.00 area marked by the 38.2% level and a Triangle pattern floor. Alternatively, a push above Triangle top resistance at 2058.30 targets the January 23 high at 2068.10.
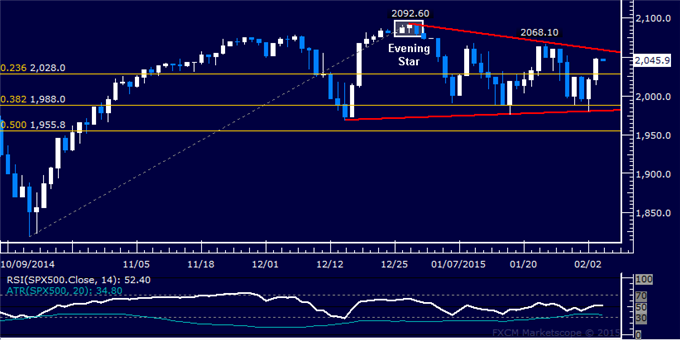
Daily Chart - Created Using FXCM Marketscope
GOLD TECHNICAL ANALYSIS – Prices are consolidating above resistance-turned-support at October’s swing highs. A daily close above the 23.6% Fibonacci expansion at 1285.20 exposes the 38.2% level at 1305.73. Alternatively, a reversal below the 38.2% Fib retracement at 1253.77 targets the 50% threshold at 1237.18.
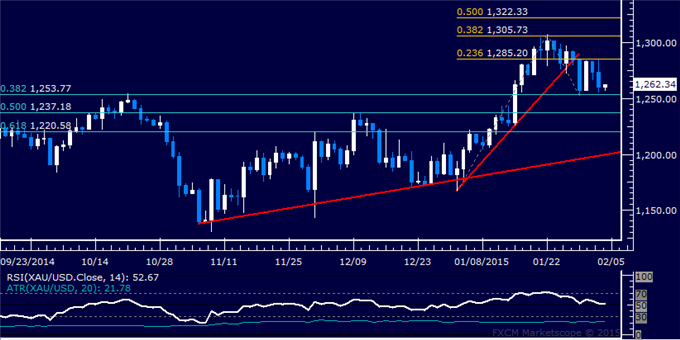
Daily Chart - Created Using FXCM Marketscope
CRUDE OIL TECHNICAL ANALYSIS – Prices pushed higher following a prolonged period of consolidation after bottoming as expected above the $45.00/barrel figure. A daily close above the 38.2% Fibonacci retracement at 59.08 exposes the 50% level at 63.38. Alternatively, a reversal below the 23.6% Fib at 53.77 targets the 14.6% retracement at 50.49.
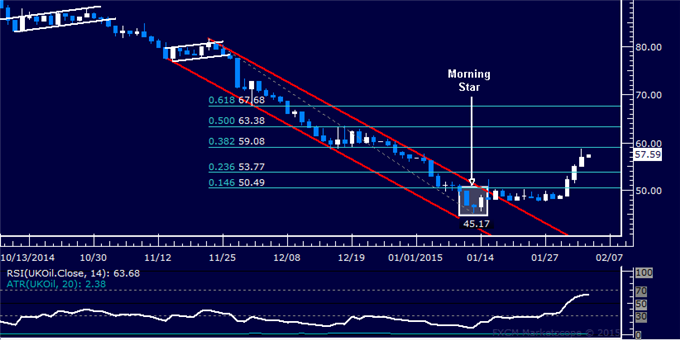
Daily Chart - Created Using FXCM Marketscope
--- Written by Ilya Spivak, Currency Strategist for DailyFX.com
To receive Ilya's analysis directly via email, please SIGN UP HERE
Contact and follow Ilya on Twitter: @IlyaSpivak
original source


