Talking Points:
- Two weeks from now brings the Bank of Japan (April 27th-28th), and the Fed (April 26th-27th), and there is a strong chance that this will be the next big instigator of volatility.
- Traders can look to trade such themes and events by watching for technical setups in anticipation of these meetings; this allows traders to trade on macro themes and price action with a careful eye on risk management.
- If you’re looking for more trading ideas, check out our Trading Guides; and if you’re looking for ideas more short-term in nature, check out our SSI indicator.
It’s a relatively quiet morning across markets, at least thus far. And while it’s always a dangerous thing to rest on one’s laurels when it comes to markets, this can also be a phenomenal time to investigate technical setups in anticipation of that next wave or leg of volatility.
So, for today’s Market Talk, we’re going to do what we often do in our Price Action webinars in looking at current technical setups across global markets to begin planning for the weeks ahead. With a rather critical Bank of Japan meeting along with FOMC over the next two weeks, there will likely be prime opportunities for volatility, and this type of setup planning is what can allow the trader to put themselves in a position to take advantage of that. As always, for each and every setup, risk management is of the upmost priority.
EUR/USD
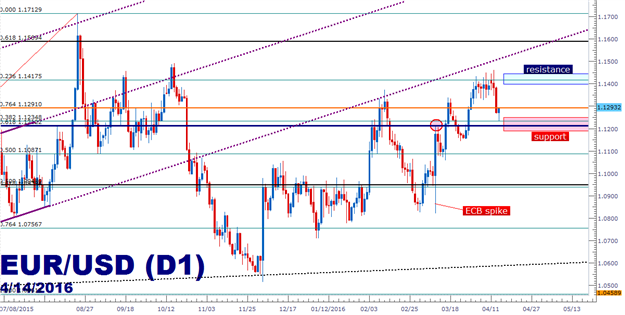
While much of the world was sure that an increase to QE would send the EUR/USD spiraling lower to that parity level, few anticipated that a dovish move from the Fed would actually offset all of that. This is precisely what’s happened, at least so far, in the wake of that March ECB meeting. Of specific interest to this setup, the spike created on the morning of that ECB announcement ran right up to a critical Fibonacci level at 1.1212 (shown in blue on the below chart), which is the 61.8% retracement of the ‘lifetime move’ in EUR/USD, taking the low from the year 2000 to the high set in 2008.
Should support develop at or above this level, traders can look at long positions back up to previous resistance values. The most recent swing-high came in at another Fib level, the 23.6% retracement of the most recent major move, and traders can look to take profits here, or perhaps scale-out a portion of the lot while moving the stop to breakeven on the remainder in the effort of looking for even higher-highs on the remainder of the lot.
Created with Marketscope/Trading Station II; prepared by James Stanley
USD/JPY
This is one that will likely see considerable volatility over the next couple of weeks given the stance of Central Banks in both Japan and the United States. Yen strength has been a pervasive theme, and this is something we’ve been discussing for the better part of seven months now. Frankly, the Bank of Japan is likely the major Central Bank with the least flexibility after three-plus years of Abe-nomics has been unable to turn the deflationary tides. The Bank is running out of bonds to buy with QE, so they started buying stocks in 2014. But that hasn’t worked out so well, as markets began collapsing less than a year after they enacted this plan. So where do they go from here? Nobody really knows, they tried moving to negative rates at the end of January, and that only spurned more risk aversion and even more Yen strength. So we’re in the process of seeing the Bank of Japan make monetary history here, and one can only hope for the best.
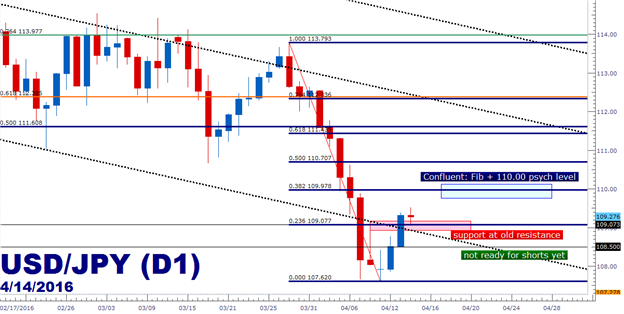
Earlier in the week we had cautioned against pushing the short USD/JPY trade as RSI divergence had begun to show on the 4-hour chart. We had pointed out levels at 108.50 and 109.00 to begin watching for resistance, but price has shot right through both of those levels, and is currently finding support on 109.00. This doesn’t necessarily eliminate the short setup, but it does urge caution.
Given that we have some degree of retracement with the past four days of price action, traders can add a Fibonacci retracement on the most recent major move (taking the 3/29 high to the 4/11 low). This offers a 38.2% Fibonacci retracement at 109.97, which is just a few pips shy of the critical 110.00 psychological level.
Should this retracement in USD/JPY continue, this could become a level of interest for future shorts ahead of next week’s BoJ meeting.
One alternative method of entry would be to evaluate today’s daily candle, and should we get a doji or spinning top, that may provide enough impetus to take a swing-trade lower. This would be a bearish harami setup, and can prelude a reversal given the middling price action seen just one bar after a big advance.
Created with Marketscope/Trading Station II; prepared by James Stanley
--- Written by James Stanley, Analyst for DailyFX.com
To receive James Stanley’s analysis directly via email, please SIGN UP HERE
Contact and follow James on Twitter: @JStanleyFX
original source


