To receive Ilya's analysis directly via email, please SIGN UP HERE
Talking Points:
- GBP/USD Technical Strategy: Flat
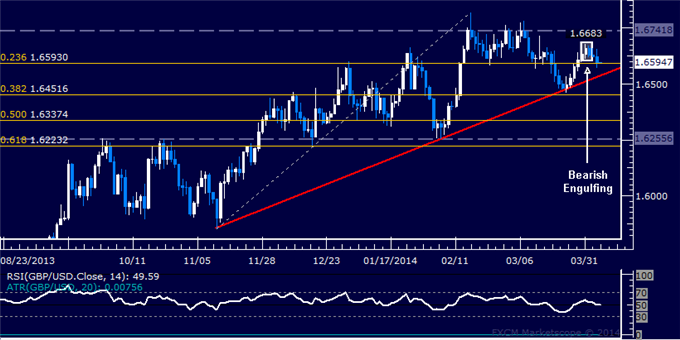
- Support: 1.6598 (23.6% Fib exp.), 1.6548 (38.2% Fib exp.)
- Resistance: 1.6683 (Mar 31 high), 1.6742 (Feb 14 close)
The British Pound started to move lower against the US Dollar as expected having produced a Bearish Engulfing candlestick patternbelow the 1.67 figure. A break below the 23.6% Fibonacci retracement at 1.6593 exposes a rising trend line set from mid-November, now at 1.6537. Alternatively, a move above resistance at the March 31 high (1.6683) exposes the February 14 close at 1.6742.
Prices are too close to relevant support to justify entering short from a risk/reward perspective. On the other hand, the absence of a bullish reversal signal hints it is premature to take up the long side. We will continue to stand aside for now.
Confirm your chart-based trade setups with the Technical Analyzer. New to FX? Start Here!
Daily Chart - Created Using FXCM Marketscope 2.0
--- Written by Ilya Spivak, Currency Strategist for DailyFX.com
original source


