Talking Points
- GBP/USD Technical Strategy: Sidelines Preferred
- Hanging Man Follow-Through May Be Limited
- Cues From Candlesticks On 4 Hour Chart Lacking
GBP/USD has continued to pullback after the appearance of a Hanging Man candlestick warned of a correction for the pair. Recent “messy” price action and a lack of follow-through for recent reversal signals suggests the latest dip may be shallow. A daily close below the 1.6270 floor would be required to indicate a more negative shift in sentiment and a possible revisit of the 2014 lows.
GBP/USD: Stumble Leaves A Hanging Man In Its Trail
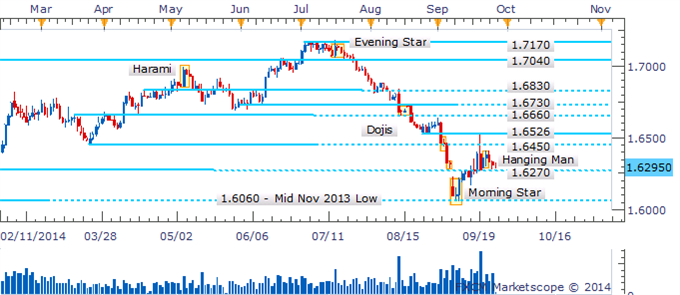
Daily Chart - Created Using FXCM Marketscope 2.0, Volume Indicator Available Here
Sideways price action on the four hour chart leaves a void of clear directional signals from candlesticks. This suggests awaiting a more constructive setup may prove a more prudent approach to playing the Pound.
GBP/USD: Awaiting Directional Cues From Candlesticks
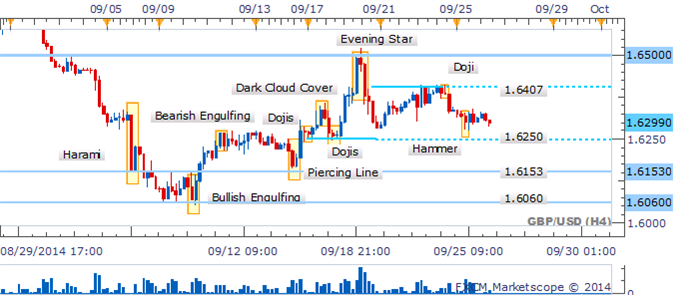
4 Hour Chart - Created Using FXCM Marketscope 2.0, Volume Indicator Available Here
By David de Ferranti, Currency Analyst, DailyFX
Follow David on Twitter: @Davidde
To receive David’s analysis directly via email, please sign up here.
Learn how to read candlesticks to help identify trading opportunities with the DailyFX Candlesticks Video Course.
original source


