Talking Points:
- US Dollar Pauses for Consolidation Following Upside Break
- S&P 500 Resistance Break Would Expose 2000 Figure Anew
- Crude Oil Struggles to Rise, Gold Vulnerable to Deeper Losses
Can’t access the Dow Jones FXCM US Dollar Index? Try the USD basket on Mirror Trader. **
US DOLLAR TECHNICAL ANALYSIS – Prices paused to consolidate following a breakout that seems to mark longer-term uptrend resumption. A daily close above the 11102-43 area marked by the 23.6% Fibonacci expansion and the October 3 high exposes the 38.2% level at 11216. Alternatively, a turn below channel top resistance-turned-support at 11010 clears the way for a test of the 10918-59 area (23.6% Fib retracement, October 15 low).
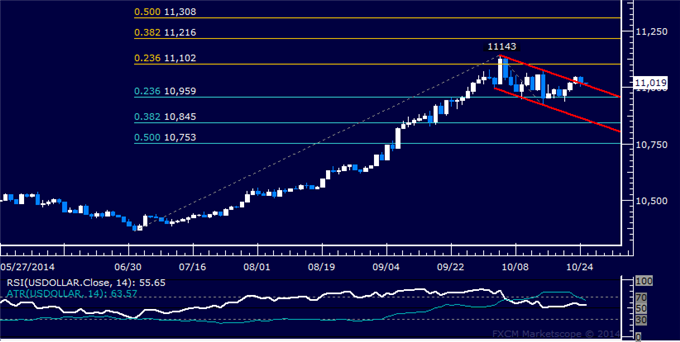
Daily Chart - Created Using FXCM Marketscope 2.0
** The Dow Jones FXCM US Dollar Index and the Mirror Trader USD basket are not the same product.
S&P 500 TECHNICAL ANALYSIS – Prices continue to push higher, with buyers eyeing resistance at 1974.10 marked by the 76.4% Fibonacci retracement. A break above that on a daily closing basis exposes the September 19 high at 2022.10. Alternatively, a turn back below the 61.8% level at 1944.50 trend line resistance-turned-support at 1936.90, followed by the 50% Fib at 1920.50.
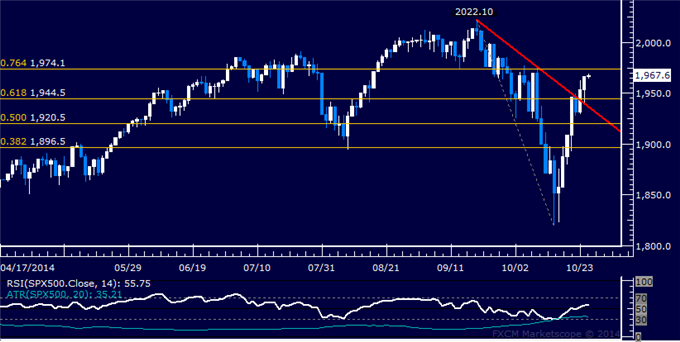
Daily Chart - Created Using FXCM Marketscope 2.0
GOLD TECHNICAL ANALYSIS – Prices turned lower as expected after putting in a bearish Evening Star candlestick pattern below resistance at a falling trend line set from mid-July. From here, a break below the 14.6% Fibonacci expansion at 1231.49 exposes the 23.6% level at 1216.87. Near-term resistance is in the 1251.27-55.20 area, marked by the trend line and the October 21 high.
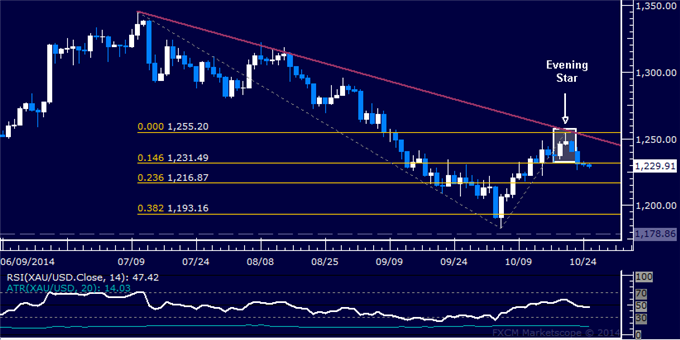
Daily Chart - Created Using FXCM Marketscope 2.0
CRUDE OIL TECHNICAL ANALYSIS – Prices put in a Bullish Engulfing candlestick pattern, hinting a bounce may be ahead. A break above the 87.67, the intersection of the 14.6% Fibonacci retracement and channel floor support-turned-resistance, exposes the 23.6% level at 90.62. Near-term support is at 82.88, the October 15 low.
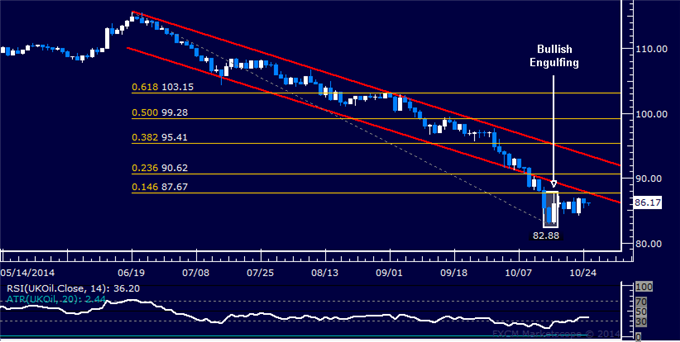
Daily Chart - Created Using FXCM Marketscope 2.0
--- Written by Ilya Spivak, Currency Strategist for DailyFX.com
To receive Ilya's analysis directly via email, please SIGN UP HERE
Contact and follow Ilya on Twitter: @IlyaSpivak
original source


