Talking Points
- USD/JPY closing in on key pivot level
- S&P 500 at important cyclical juncture
- EUR/USD nearing major support zone
Get real time volume on your charts for free. Click HERE
Foreign Exchange Price & Time at a Glance:
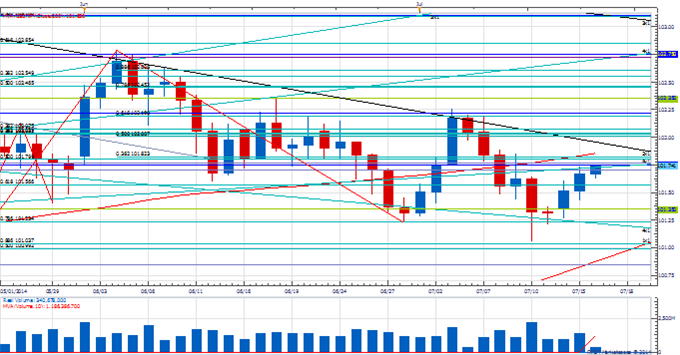
Price & Time Analysis: USD/JPY
Charts Created using Marketscope – Prepared by Kristian Kerr
- USD/JPY continues to grind higher following last week’s reversal from the 101.05 88.6% retracement of the May to June advance
- Our near-term trend bias is higher in the exchange rate
- A move over 102.25 is required to confirm the start of a more important trend move higher
- A cycle turn window is eyed next week
- Any weakness under 101.05 would re-focus our attention lower
USD/JPY Strategy: Square, but looking to buy a break of 102.25 and 102.80.
Instrument | Support 2 | Support 1 | Spot | Resistance 1 | Resistance 2 |
USD/JPY | *101.05 | 101.35 | 101.75 | *102.25 | 102.80 |
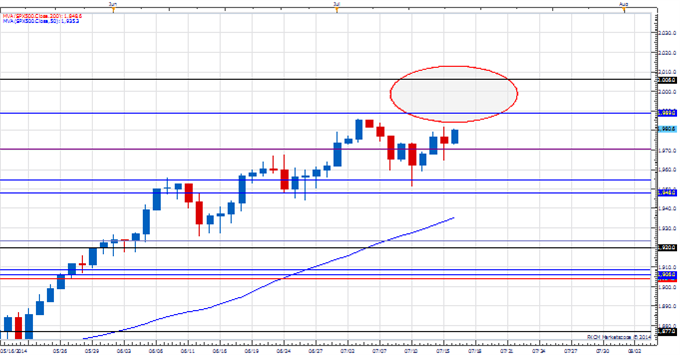
Price & Time Analysis: S&P 500
Charts Created using Marketscope – Prepared by Kristian Kerr
- S&P 500 has moved steadily higher over the past few days and is just a few points shy of a new all-time high
- Our near-term trend bias is higher in the index
- A convergence of various Gann and Fibonacci levels between 1989 and 2006 looks like a potentially important resistance area
- A cycle turn window of some importance is eyed over the next few days
- A daily close under 1960 will turn us negative on the S&P 500
S&P 500 Strategy: Like reducing long positions into this cycle turn window. Will look to go short if a close under 1960 is seen.
Instrument | Support 2 | Support 1 | Spot | Resistance 1 | Resistance 2 |
S&P 500 | *1960 | 1970 | 1980 | *1989 | *2006 |
Focus Chart of the Day: EUR/USD
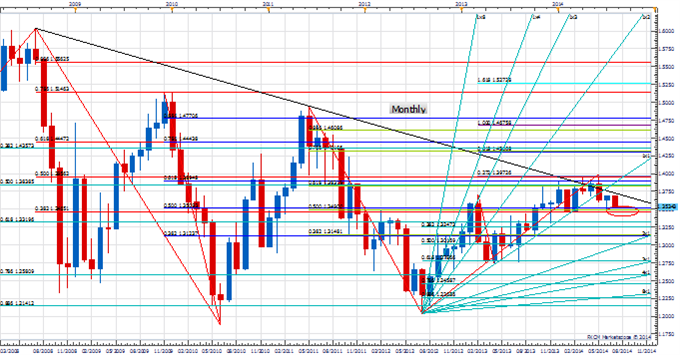
The weakness in EUR/USD over the past couple of days is getting people excited about the possibility of a meaningful downtrend commencing here in the exchange rate. We are sympathetic to this view as the long-term cyclical outlook seems to favor weakness over the second half of the year. However, the euro has been a bit of a “widow maker” over the past few years and there are certain things we will need to see before getting more excited about the downside. Above is the monthly chart of EUR/USD extending back to the all-time high recorded in 2008. We have drawn simple Fibonacci retracements and extensions from all the major swing points since then. As the chart shows, the confluence zone between 1.3460 and 1.3510 has proven to be a critical support area and marked the “bottom of the range” for the last 8-months (the confluence near 1.3950 has marked the top end). Obviously this zone is critical and looks even more so when you factor in other methodologies like Gann. The weakness over the past few days has been a nice treat (we have been short), but the real test is coming up.
To receive Kristian’s analysis directly via email, please SIGN UP HERE.
This publication attempts to further explore the concept that mass movements of human psychology, as represented by the financial markets, are subject to the mathematical laws of nature and through the use of various geometric, arithmetic, statistical and cyclical techniques a better understanding of markets and their corresponding movements can be achieved.
--- Written by Kristian Kerr, Senior Currency Strategist for DailyFX.com
To contact Kristian, e-mail kkerr@fxcm.com. Follow me on Twitter @KKerrFX
original source


