Talking Points
- EUR/USD stuck between two Gann levels
- AUD/USD rebounds off key Fibonacci convergence
- Key cyclical period here for EUR/JPY
Get real time volume on your charts for free. Click HERE
Foreign Exchange Price & Time at a Glance:
Price & Time Analysis: EUR/USD
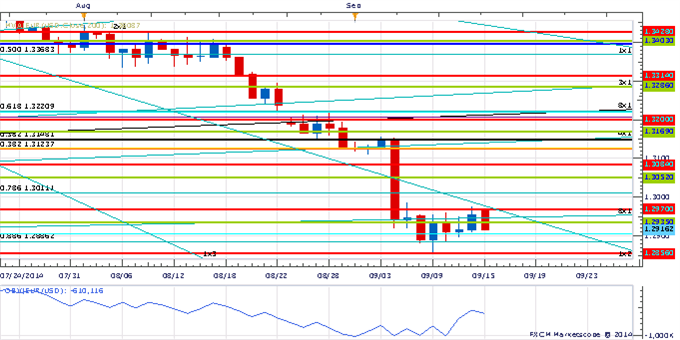
Charts Created using Marketscope – Prepared by Kristian Kerr
- EUR/USD remains in consolidation mode above the 1st square root relationship of the 2013 low near 1.2860
- Our near-term trend bias remains lower in the rate while below the 1x2 Gann angle line of the year’s high near 1.2990
- A close under 1.2860 is needed to trigger a further decline in the rate
- An important turn window is eyed later in the month
- A close below over 1.2990 would turn us positive on the euro
EUR/USD Strategy: Like holding reduced short positions while below 1.2990
Instrument | Support 2 | Support 1 | Spot | Resistance 1 | Resistance 2 |
EUR/USD | 1.2815 | *1.2960 | 1.2915 | 1.2970 | *1.2990 |
Price & Time Analysis: AUD/USD
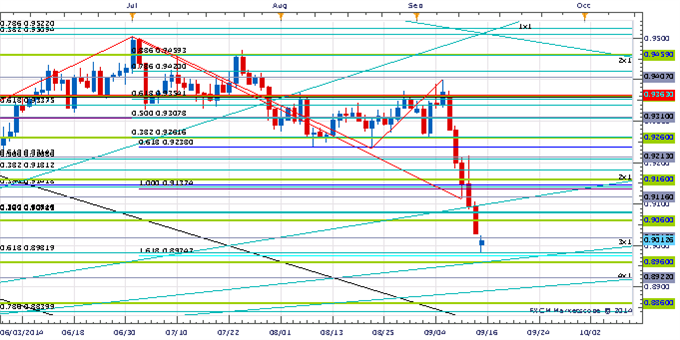
Charts Created using Marketscope – Prepared by Kristian Kerr
- AUD/USD touched its lowest level since early March before finding support near the 61.8% retracement of the year’s range in near .8980
- Our near-term trend bias is lower in the Aussie while below .9105
- Weakness under .8980/60 is needed to clear the way for a new leg lower in the rate
- An important cycle turn window is eyed later next week/early next week
- A move over .9105 would turn us positive on AUD/USD
AUD/USD Strategy: Like holding reduced short positions while below .9105.
Instrument | Support 2 | Support 1 | Spot | Resistance 1 | Resistance 2 |
AUD/USD | *.8960 | .8980 | .9010 | .9065 | *.9105 |
Focus Chart of the Day: EUR/JPY
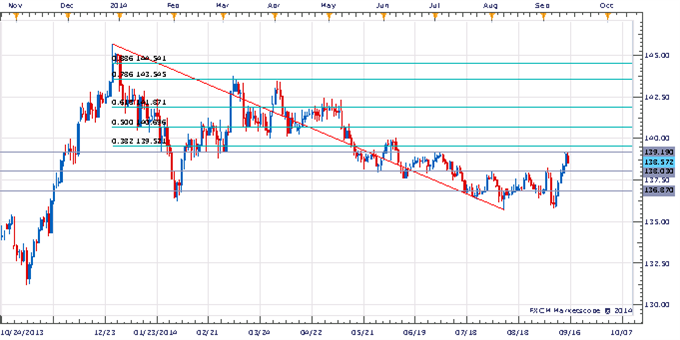
The Armstrong 8.6 month Pi cycle is one of my favorite intervals to monitor. Measuring this interval from important highs and lows is an easy and pretty effective way to incorporate cyclical analysis. I have found that more times than not the relationship will illicit some sort of market reaction. The unknown is duration. Today is 8.6 months from the big high last year in EUR/JPY. This time last week it looked like some sort of low would come out of this “turn window” as the cross was languishing near the lows of the year. The market, however, has thrown us a bit of a “curve ball” as the cross has rallied sharply over the past 5 days or so setting up a potential secondary high into this key period – an “inversion” in cyclical parlance. Inversions are not my favorite type of setup as they are prone to misinterpretation, but on the plus side they do offer opportunities to align oneself with the broader trend. In the case of EUR/JPY, the levels seem pretty clear and well defined. This morning the cross touched the 3rd square root relationship of the year’s low near 103.20 before reversing. The 38% retracement of 2013/2014 decline is just above that at 139.55. If a meaningful reversal is setting up here I would expect this resistance zone to hold.
To receive Kristian’s analysis directly via email, please SIGN UP HERE.
This publication attempts to further explore the concept that mass movements of human psychology, as represented by the financial markets, are subject to the mathematical laws of nature and through the use of various geometric, arithmetic, statistical and cyclical techniques a better understanding of markets and their corresponding movements can be achieved.
--- Written by Kristian Kerr, Senior Currency Strategist for DailyFX.com
To contact Kristian, e-mail kkerr@fxcm.com. Follow me on Twitter @KKerrFX
original source


