Talking Points
- Price & Time covers key technical themes daily and can be delivered to your inbox each morning by joining the distribution list: Price & Time
- USD/JPY touches 7-month low
- NZD/USD tests important confluence zone
Get real time volume on your charts for free. Click HERE
Foreign Exchange Price & Time at a Glance:
Price & Time Analysis: USD/JPY
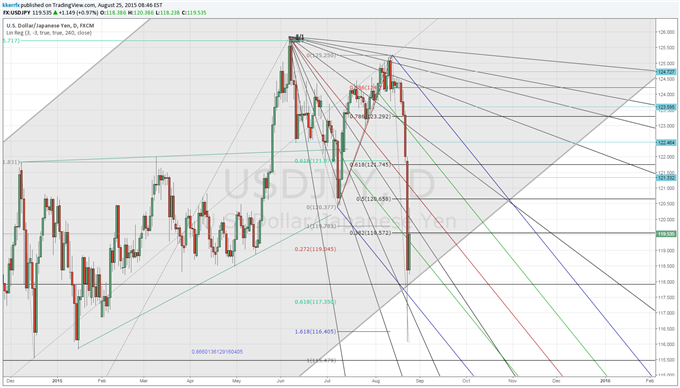
ChartPrepared by Kristian Kerr
- USD/JPY fell to its lowest level since mid-January yesterday before finding support around the 161.8% expansion of the June – July decline around 116.40
- Our near-term trend bias is lower in the exchange rate while below 121.00
- A close below a convergence of various Fibonacci and Gann levels around 117.80 is needed to set off a new leg lower in the rate
- A very minor turn window is eyed Thursday
- A daily close back over 121.00 would turn us positive on USD/JPY
USD/JPY Strategy: Like the short side while below 121.00.
Instrument | Support 2 | Support 1 | Spot | Resistance 1 | Resistance 2 |
USD/JPY | 116.40 | *117.80 | 119.55 | 120.60 | *121.00 |
Price & Time Analysis: EUR/CAD
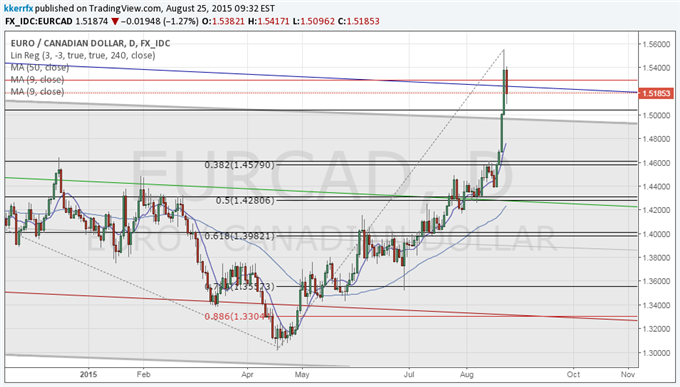
ChartPrepared by Kristian Kerr
- EUR/CAD traded at its highest level since March of last year on Monday
- Our near-term trend bias is positive on the cross while over 1.5060
- A move through the March 2014 high around 1.5390 is needed to confirm the start of a new leg higher
- A Fibonacci turn window was in play yesterday
- A daily close below 1.5060 would turn us negative on the rate
USD/CAD Strategy: Like holding only a reduced long position while over 1.5060.
Instrument | Support 2 | Support 1 | Spot | Resistance 1 | Resistance 2 |
EUR/CAD | *1.5060 | 1.5090 | 1.5185 | 1.5300 | *1.5390 |
Focus Chart of the Day: NZD/USD
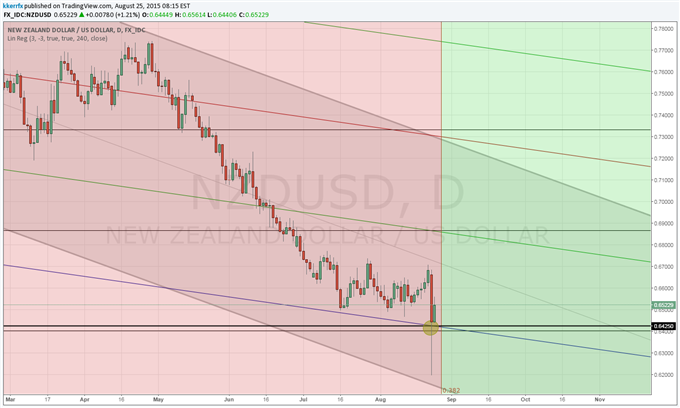
NZD/USD (like many other markets) seems to be at a key juncture. What makes kiwi particularly interesting is the timing this week as it marks a 38% retracement in time (0.382 being significant as it is 0.618 squared) of the distance between the August 2011 and the July 2014 highs. In the past we have been a bit dismissive of 38% time relationships and it has been to our detriment as some pretty key turns have occurred around this relationship. A notable example would be the reversal in EUR/USD in October 2006 as that occurred on a near perfect 38% time retracement of the 1985 Plaza Accord low (in the synthetic ECU) and the all-time traded low in the euro in October of 2000. Heading into this week we were thinking that the .6400 area in NZD/USD would be a natural attraction for the market as it is a clear confluence of Andrews, Gann and Fibonacci levels. Yesterday’s two big figure move below .6400 was clearly more than just an undercut of support from an intraday perspective, but interestingly the market came roaring back to finish the day just above this key price zone. Now the big question is - was that an important low? We are open to that possibility while .6400 continues to hold on a closing basis, but it would probably take a move through last week’s closing high to get us excited about the upside. Given the extreme volatility being witnessed at the moment, intraday probes below .6400 would not surprise, but a daily close below would raise the risk of a downside acceleration around this window.
To receive Kristian’s analysis directly via email, please SIGN UP HERE.
--- Written by Kristian Kerr, Senior Currency Strategist for DailyFX.com
This publication attempts to further explore the concept that mass movements of human psychology, as represented by the financial markets, are subject to the mathematical laws of nature and through the use of various geometric, arithmetic, statistical and cyclical techniques a better understanding of markets and their corresponding movements can be achieved.
To contact Kristian, e-mail kkerr@fxcm.com. Follow me on Twitter @KKerrFX
original source


