What’s inside:
- S&P 500 trading around key lower parallel, but sloppily so
- A full recapture of this parallel on daily closing basis needed to maintain
- Price levels in play, need to keep flexible and watch how price action reacts
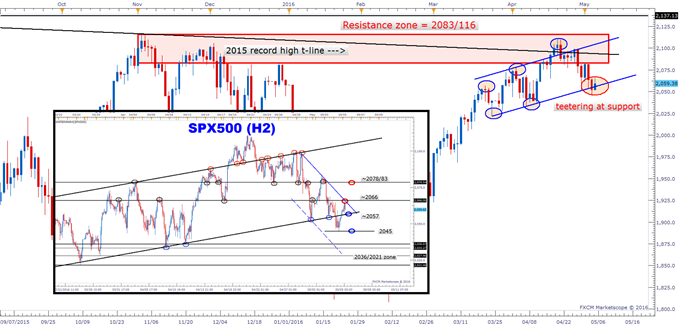
Yesterday, the S&P 500 (FXCM: SPX500) breached the lower-side parallel we’ve been discussing for a few days now on an intra-day basis, but didn’t close out the session convincingly below. Things are getting a little sloppy around this lower parallel, providing cause for indecision. So far as we head into U.S. trade the S&P is back above the lower parallel, but now faces a trend-line off the 4/28 peak and the 2066 area which has seen good action over the past month.
If the market can maintain trade above the lower parallel on a daily closing bar basis and move beyond the before mentioned resistance, then we will need to turn our focus towards the 2078/83 area, which holds short-term and long-term implications.
However, if the market begins to roll back over, undermining the lower parallel once again, it will be considered a failed attempt to recapture support (especially if it moves above only to close the day below, potentially today) and the downtrend off the 4/28 peak will still be very much alive.
Short-term support and resistance: Support comes in at the lower parallel around 2057, then yesterday’s low at 2045, beyond there we look the March/April levels between 2036 and 2021. Resistance comes in by way of the downtrend line off the 4/28 peak, which roughly coincides with horizontal resistance around 2066, then beyond there the short/long-term area in the 2078/83 vicinity.
SPX500 Daily/2-hr
There are some good price levels and technical structures from which to operate off of, but one needs to be flexible in changing their views based on price action around these various levels and technical events.
At the end of the day, the market is hanging at a precarious spot and the S&P will need to quickly turn higher or soon join the lagging Nasdaq 100.
Looking for live market sentiment data? Check out the FXCM SSI Indicator.
---Written by Paul Robinson, Market Analyst
You can follow Paul on Twitter @PaulRobinsonFX, or email him directly at probinson@fxcm.com with any questions or comments.
original source


