- US Dollar testing critical resistance, poised for break higher
- Forex volatility prices show that markets are on the verge of key shift
- Our focus remains on key US Dollar and Yen pairs
The US Dollar is on the verge of a major break higher, and these are the currency pairs we believe are most likely to see big moves.
Traders continue to buy the Greenback versus the Euro, Sterling, and other major counterparts as the Dow Jones FXCM Dollar Index trades into critical resistance. The key question becomes whether this is indeed the start of a much larger breakout. If it is, our focus shifts to Dollar trades against the Sterling and the commodity dollars.
Dollar Index Testing Critical Resistance as Volatility Rises
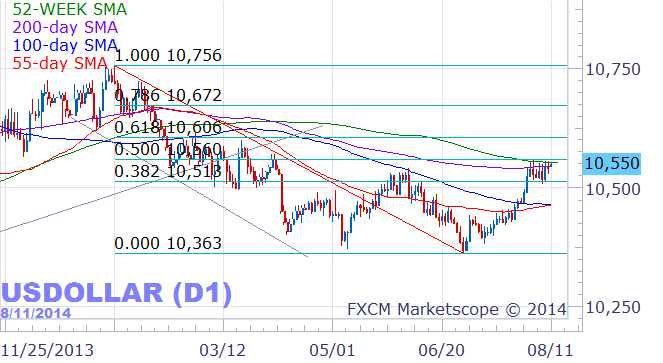
Source: FXCM Trading Station Desktop, Prepared by David Rodriguez.
Forex volatility prices indeed suggest we are at a potentially significant turning point in market conditions. Markets show that prices on long-dated volatility are setting a series of higher highs and higher lows. It’s obviously early still—particularly as volatility remains in a clear 6-year downtrend—yet the recent recovery off of record-lows makes this an important early warning sign.
Forex Volatility Prices Show Early Signs of Lasting Reversal
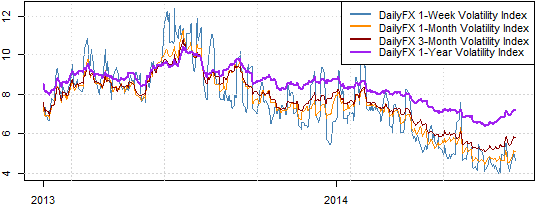
Data source: Bloomberg, DailyFX Calculations
We thus look to individual dollar pairs for potential trades, and a recent look at FX positioning suggests that the GBPUSD, AUDUSD, NZDUSD, and USDCAD may offer good opportunities to get long the US Dollar.
According to CFTC Commitment of Traders data, large speculators are heavily long the US Dollar versus the Euro and the Japanese Yen. EURUSD-short and USDJPY-long positions thus look a bit crowded, but the same data shows that traders are actually still net-short the Greenback versus the GBP, AUD, NZD, and CAD. All else remaining equal, this suggests that the Dollar has further room to run versus these currencies.
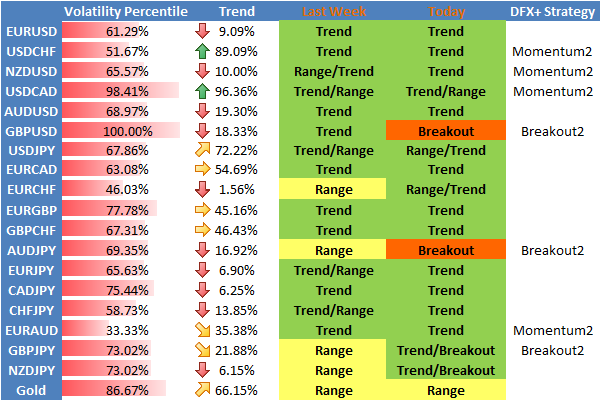
If this is indeed the start of a larger Dollar breakout, these become our favored trades. See the table below for full rundown on a per-currency pair basis and keep track of changing conditions with future e-mail updates via my distribution list.
DailyFX Individual Currency Pair Conditions and Trading Strategy Bias

Automate our SSI-based trading strategies via Mirror Trader free of charge
--- Written by David Rodriguez, Quantitative Strategist for DailyFX.com
To receive the Speculative Sentiment Index and other reports from this author via e-mail, sign up to David’s e-mail distribution list via this link.
Contact David via Twitter at http://www.twitter.com/DRodriguezFX
Definitions
Volatility Percentile – The higher the number, the more likely we are to see strong movements in price. This number tells us where current implied volatility levels stand in relation to the past 90 days of trading. We have found that implied volatilities tend to remain very high or very low for extended periods of time. As such, it is helpful to know where the current implied volatility level stands in relation to its medium-term range.
Trend – This indicator measures trend intensity by telling us where price stands in relation to its 90 trading-day range. A very low number tells us that price is currently at or near 90-day lows, while a higher number tells us that we are near the highs. A value at or near 50 percent tells us that we are at the middle of the currency pair’s 90-day range.
Range High – 90-day closing high.
Range Low – 90-day closing low.
Last – Current market price.
Bias – Based on the above criteria, we assign the more likely profitable strategy for any given currency pair. A highly volatile currency pair (Volatility Percentile very high) suggests that we should look to use Breakout strategies. More moderate volatility levels and strong Trend values make Momentum trades more attractive, while the lowest Vol Percentile and Trend indicator figures make Range Trading the more attractive strategy.
HYPOTHETICAL PERFORMANCE RESULTS HAVE MANY INHERENT LIMITATIONS, SOME OF WHICH ARE DESCRIBED BELOW. NO REPRESENTATION IS BEING MADE THAT ANY ACCOUNT WILL OR IS LIKELY TO ACHIEVE PROFITS OR LOSSES SIMILAR TO THOSE SHOWN. IN FACT, THERE ARE FREQUENTLY SHARP DIFFERENCES BETWEEN HYPOTHETICAL PERFORMANCE RESULTS AND THE ACTUAL RESULTS SUBSEQUENTLY ACHIEVED BY ANY PARTICULAR TRADING PROGRAM.
ONE OF THE LIMITATIONS OF HYPOTHETICAL PERFORMANCE RESULTS IS THAT THEY ARE GENERALLY PREPARED WITH THE BENEFIT OF HINDSIGHT. IN ADDITION, HYPOTHETICAL TRADING DOES NOT INVOLVE FINANCIAL RISK, AND NO HYPOTHETICAL TRADING RECORD CAN COMPLETELY ACCOUNT FOR THE IMPACT OF FINANCIAL RISK IN ACTUAL TRADING. FOR EXAMPLE, THE ABILITY TO WITHSTAND LOSSES OR TO ADHERE TO A PARTICULAR TRADING PROGRAM IN SPITE OF TRADING LOSSES IS MATERIAL POINTS WHICH CAN ALSO ADVERSELY AFFECT ACTUAL TRADING RESULTS. THERE ARE NUMEROUS OTHER FACTORS RELATED TO THE MARKETS IN GENERAL OR TO THE IMPLEMENTATION.
OF ANY SPECIFIC TRADING PROGRAM WHICH CANNOT BE FULLY ACCOUNTED FOR IN THE PREPARATION OF HYPOTHETICAL PERFORMANCE RESULTS AND ALL OF WHICH CAN ADVERSELY AFFECT ACTUAL TRADING RESULTS.
Any opinions, news, research, analyses, prices, or other information contained on this website is provided as general market commentary, and does not constitute investment advice. The FXCM group will not accept liability for any loss or damage, including without limitation to, any loss of profit, which may arise directly or indirectly from use of or reliance contained in the trading signals, or in any accompanying chart analyses.
original source


