To receive Ilya's analysis directly via email, please SIGN UP HERE
Talking Points:
- USD/CAD Technical Strategy: Long at 1.0935
- Support: 1.1017 (14.6% Fib exp.), 1.0857 (Apr 9 low)
- Resistance: 1.1056 (trend line), 1.1116 (23.6% Fib exp.)
The US Dollar continues to inch upward against its Canadian counterpart having bounced as expected after forming a Bullish Engulfing candlestick pattern. Prices edged past the 14.6% Fibonacci expansion at 1.1017 to expose a rising trend line set from mid-January (now at 1.1056). A break above this barrier on a daily closing basis initially exposes the 23.6% Fib at 1.1116. Alternatively, a move back below 1.1017 sees the next layer of support is at 1.0857, the April 9 low.
We bought USD/CAD at 1.0935 and took profit on half of the trade at 1.1017. The remainder of the position remains open to capture the possibility of a move above resistance, exposing 1.1116 as the next upside objective. The stop-loss is now at the breakeven level (1.0935).
Confirm your chart-based trade setups with the Technical Analyzer. New to FX? Start Here!
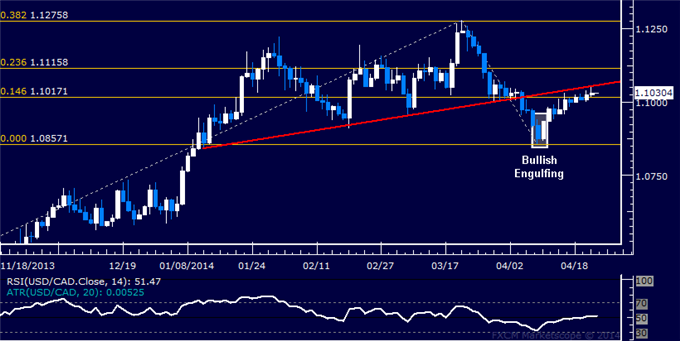
Daily Chart - Created Using FXCM Marketscope 2.0
--- Written by Ilya Spivak, Currency Strategist for DailyFX.com
original source


