- AUD/USD .7719 is a biggie
- NZD/USD about to get hammered?
- USD/CAD wedge / direction unclear
--Subscribe to Jamie Saettele's distribution list in order to receive a free report to your inbox several times a week.
--For more analysis and trade setups (including current positions and the ‘watchlist’), visit SB Trade Desk
--Free trading tips
EUR/USD
Weekly
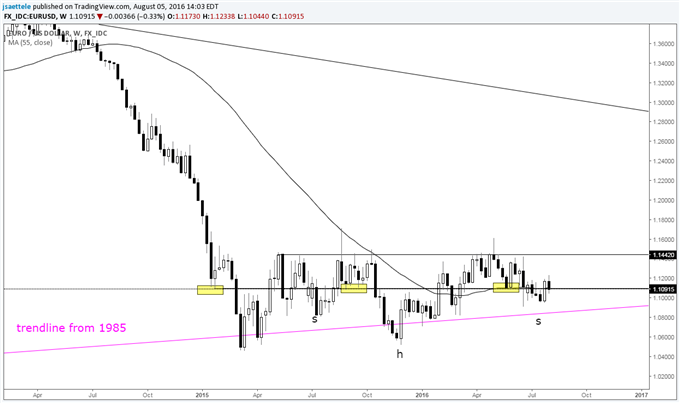
Chart Prepared by Jamie Saettele, CMT
See REAL TIME trader positioning
High Frequency Trading Tools
-Long term EUR/USD comments are unchanged. “EUR/USD has been trading sideways since March 2015. This is one of the longest sideways periods in history (as defined by the length of time between 52 week closing price extremes) and the eventual break will trigger a significant directional move. My contention has been that the move will be higher given the presence of the 31 year trendline as a floor.” The outside week offers ‘something to work with’ on the bull side now. Price is back above the 55 week average as well, which proved important as resistance and support at several junctures over the last year. SSI has flipped to negative, which is viewed as a positive for price. An inverse head and shoulders pattern is visible from the May 2015 high and could launch a major advance. As always, define your risk points (read more about traits of successful traders here).
-For forecasts and 2016 opportunities, check out the DailyFX Trading Guides.
GBP/USD
Monthly
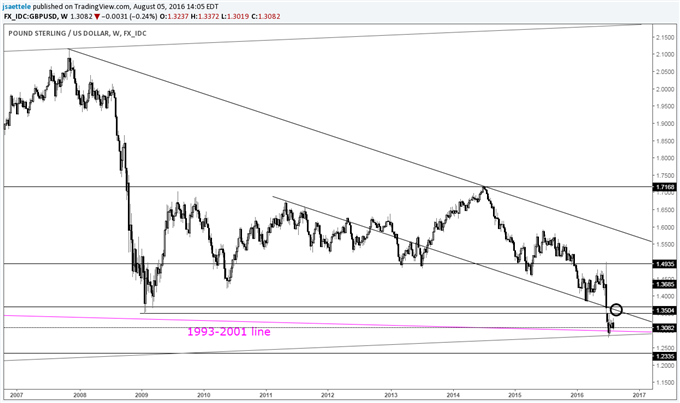
Chart Prepared by Jamie Saettele, CMT
See REAL TIME trader positioning
-The gap to open trading post-Brexit is thus far of the breakaway variety but the July low is just pips below the 78.6% retracement of the 1985-2007 range. A long term trendline is also under price and the July candle sports a long lower wick, which can indicate demand. In other words, it’s possible that a major low has formed. Remember, there is a 96 month (8 year) cycle low count so any rally could result in a re-test of the low in February.
AUD/USD
Weekly
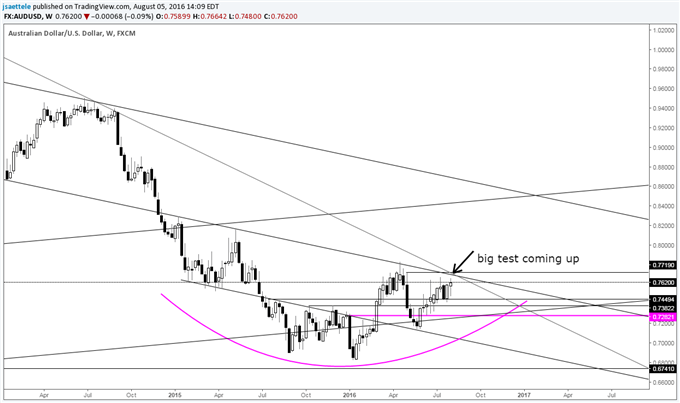
Chart Prepared by Jamie Saettele, CMT
See REAL TIME trader positioning
-AUD/USD is approaching an important juncture defined by slope considerations and the pre-May rate cut high at .7719. This level may be resistance but a break above would leave Aussie in full blown bull camp with focus on the May 2015 high at .8163 and eventually .8600+.
NZD/USD
Weekly
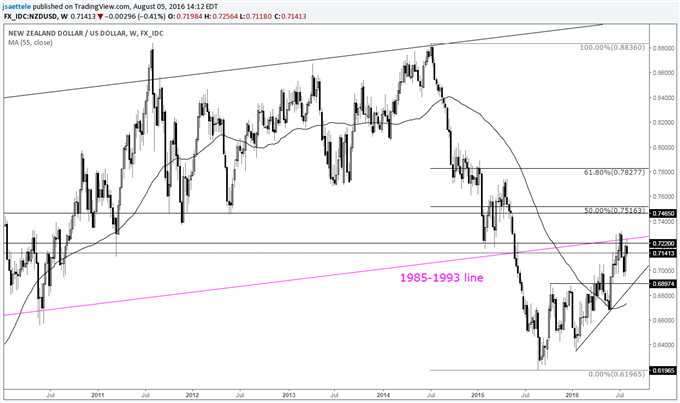
Chart Prepared by Jamie Saettele, CMT
See REAL TIME trader positioning
-NZD/USD has turned down from a long term parallel and major horizontal levels. I had been looking for .6900 (resistance in 2015) to provide support but Kiwi has turned up sharply before the level. That turn higher might end up contributing to a more bearish outcome for the bird as operations constructed a possible head and shoulders top from the June high.
USD/JPY
Weekly
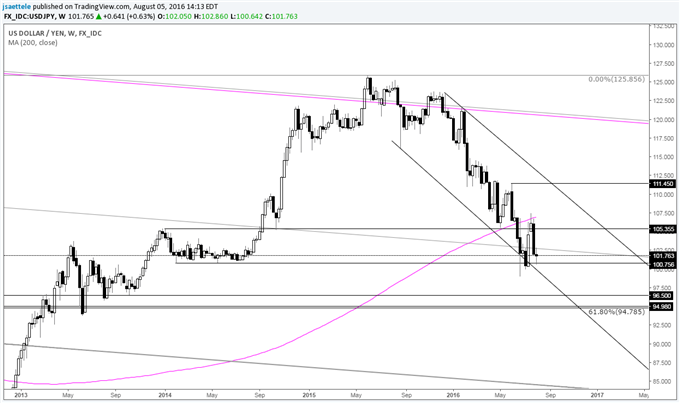
Chart Prepared by Jamie Saettele, CMT
See REAL TIME trader positioning
-USD/JPY is holding up at the 2014 base and channel base. I’m inclined to look higher but would be aware of 105.40 (January 2014 high, October 2014 low and May 2016 low) as resistance. The caveat here is that the 200 week average was resistance at the recovery high AFTER providing support in May. This dynamic has played out a number of times, most recently in December 2007, and given way to extended declines.
USD/CAD
Weekly
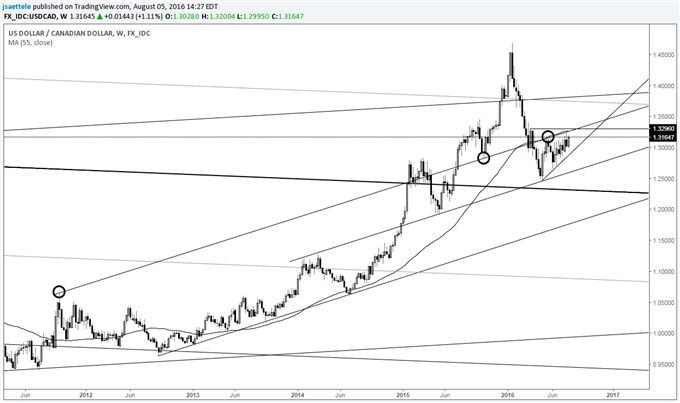
Chart Prepared by Jamie Saettele, CMT
See REAL TIME trader positioning
-USD/CAD is again nearing the 55 week average, which was resistance in May and July. The average was support for the last 3 years so the fact that the average has been acting as resistance warns that a bearish cycle may be underway. Price action since the May low could also end up as a wedge. A bearish wedge would be confirmed on a break under the wedge support, which is near 1.2900. A break through 1.3300 would trigger a breakout from a running wedge…which would be bullish.
USD/CHF
Weekly
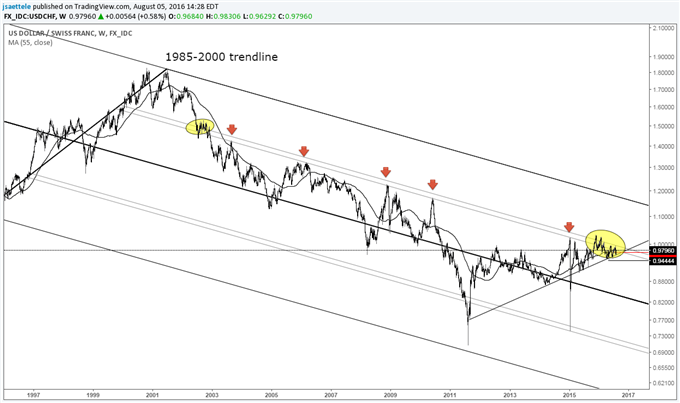
Chart Prepared by Jamie Saettele, CMT
See REAL TIME trader positioning
-Failed breakout attempts late in 2015 and early in 2016 warned of an eventual downside break. However, downside probes (April through June) have held a multi-year support line (back at that line again). The holding pattern that has persisted since March 2015 will eventually give way to the next trending phase towards either the low .80s or 1.16-1.17.
original source


