Daily
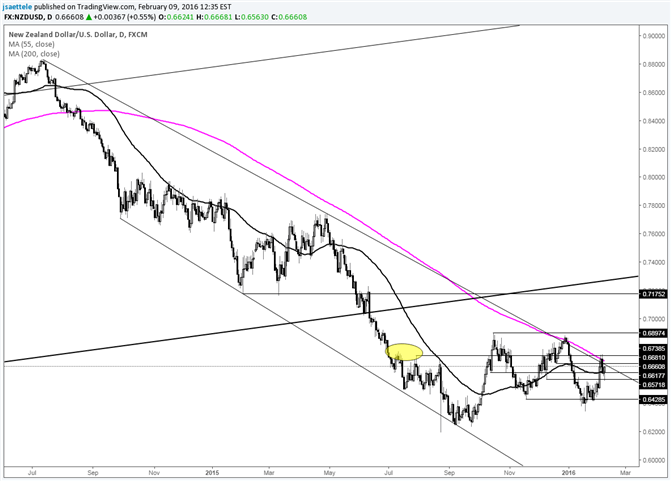
Chart Prepared by Jamie Saettele, CMT
DailyFX Trading Guides and Forecasts
-Since reversing on 1/20, NZD/USD has retraced most of its early year decline. The rally and sideways trade since September can be interpreted as waves A and B or 1 and 2 within a new bullish cycle. That said, a prolonged period of sideways trading (in the event that trade since October is a B wave) is a possibility. Either way, last week’s high, defined by the 200 day average and long term trendline, is significant.
For more analysis and trade setups (exact entry and exit), visit SB Trade Desk
original source


