Talking Points:
- NZD/USD to Preserve Wedge/Triangle Formation on New Zealand Trade Deficit, RBNZ Verbal Intervention.
- USDOLLAR Outlook Remains Mired by Bearish Patterns, Limited Fed Expectations.
Avoid the pitfalls of trading by steering clear of classic mistakes. Review these principles in the "Traits of Successful Traders" series.
NZD/USD
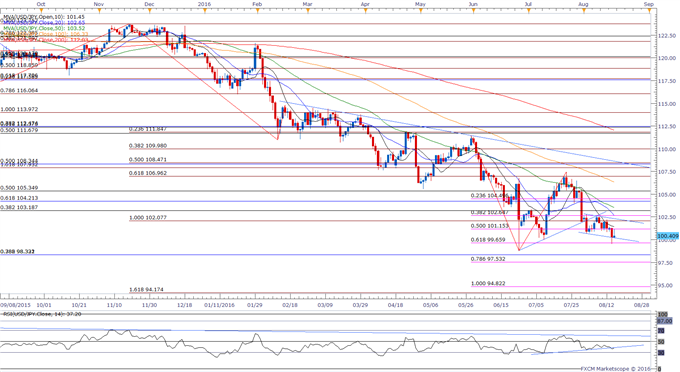
Chart - Created Using FXCM Marketscope 2.0
- NZD/USD tags a fresh 2016 high of 0.7339 as Reserve Bank of New Zealand (RBNZ) Governor Graeme Wheeler talks down bets for back to back rate-cuts and argues against ‘rapid’ easing, but the pair may continue to consolidate within a wedge/triangle formation over the remainder of the month as the central bank retains the verbal intervention on the local currency.
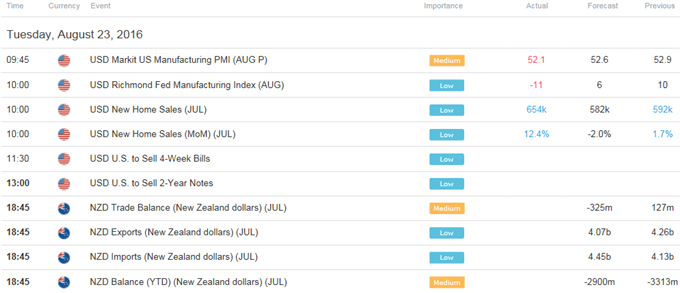
- At the same time, New Zealand’s Trade Balance report is anticipated to show a NZ$ 325M deficit in July after posting a NZ$ 127M surplus the month prior, and a marked deterioration in the Balance of Payments (BoP) may produce a near-term pullback in NZD/USD as it dampens the outlook for growth.
- Still waiting for a break/close above the Fibonacci overlap around 0.7330 (38.2% retracement) to 0.7340 (61.8% expansion) to see NZD/USD extend the advance from earlier this year, with the next topside region of interest coming in around 0.7410 (78.6% retracement) to 0.7430 (61.8% retracement).
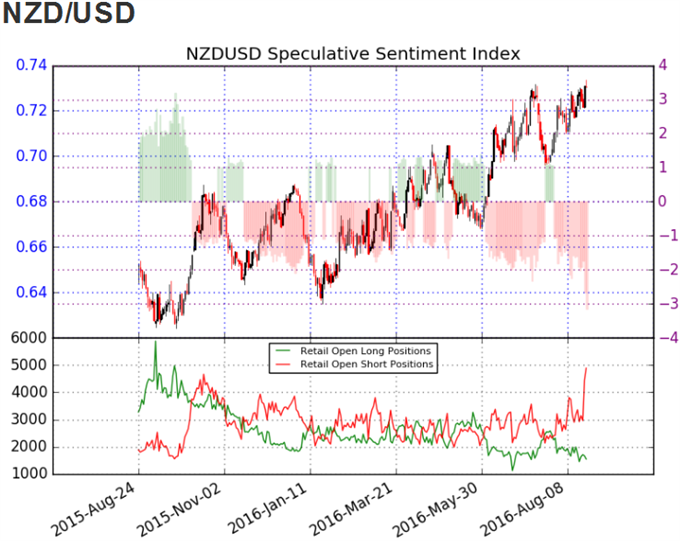
- The DailyFX Speculative Sentiment Index (SSI) shows the FX crowd remains net-short NZD/USD since July 28, with retail sentiment pushing to fresh 2016 extremes as it slips below the -3.00 mark.
- The ratio currently sits at -3.19 as 24% of traders are long, with short positions 57.5% higher from the previous week, while open interest stands 30.8% above the monthly average.
Why and how do we use the SSI in trading? View our video and download the free indicator here
USDOLLAR(Ticker: USDollar):
Index | Last | High | Low | Daily Change (%) | Daily Range (% of ATR) |
DJ-FXCM Dollar Index | 11878.84 | 11887.48 | 11857.29 | -0.08 | 52.53% |
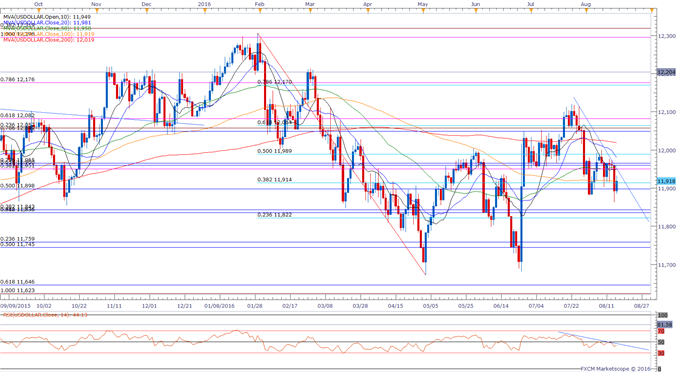
Chart - Created Using FXCM Marketscope 2.0
- The USDOLLAR may continue to give back the rebound from the June low (11,681) as price & the Relative Strength Index (RSI) preserve the bearish formations carried over from the previous month, while Fed Funds Futures continue to highlight limited expectations for a 2016 Fed rate-hike.
- With market attention turning to the Fed Economic Symposium in Jackson Hole, Wyoming, fresh comments from Fed Chair Janet Yellen may heavily impact the outlook for monetary policy, but another series of mixed U.S. data prints may produce near-term headwinds for the greenback as the central bank continues to warn ‘most survey-based measures of longer-run inflation expectations were little changed, on balance, while market-based measures of inflation compensation remained low.’
- Waiting for a break/close below 11,822 (23.6% retracement) to 11,843 (38.2% retracement) to open up the next downside target around 11,745 (50% retracement) to 11,759 (23.6% retracement).
Click Here for the DailyFX Calendar
Get our top trading opportunities of 2016 HERE
Check out FXCM’s Forex Trading Contest
Read More:
WTI Crude Oil Price Forecast: Oil Firm on News of Iranian Support
COT-Record British Pound Ownership Profile for 4th Straight Week
Near-term Setups in AUDUSD, NZDUSD & USDOLLAR
S&P 500 Technical Outlook: Wedge Breaks
--- Written by David Song, Currency Analyst
To contact David, e-mail dsong@dailyfx.com. Follow me on Twitter at @DavidJSong.
To be added to David's e-mail distribution list, please follow this link.
original source


