 S&P 500
 To receive James Stanley’s analysis directly via email, please SIGN UP HERE
Talking Points:
- S&P 500 Technical Strategy: Limited out of previous setup; currently flat.
- A heavy week of data may bring in a deeper retracement that could potentially be used for top-side reentries.
- If you’re looking for trading ideas, check out our Trading Guides. And if you want something more short-term in nature, check out our SSI indicator.
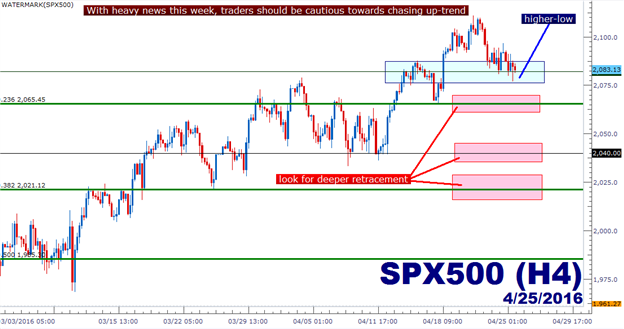
In our last article we looked at another trend-side entry in the S&P, using recent support structure to plot potential re-entries. The support structure looked at in our last article utlized the move seen last year, taking the top at 2,137.10 to the ‘Chinese Black Monday’ low on August 24th. And while a lower-low was printed in January and again in February, that Fibonacci retracement has continued to offer usable levels for traders, most recently offering a top-side re-entry off of the 76.4% retracement at 2,065.45.
As of right now, price actionappears to be carving out a higher-low point of support at the same level that set the high on 12/29-12/30 of 2015; just before price action began the deluge to kick off a whole new stream of worries in the new year. This is a pivotal level at 2,082.10, and over the past week we’ve seen price action find resistance, break above, and now set support at this level; giving the appearance of yet another higher-low.
But before chasing the up-trend, traders would likely want to peruse the economic calendar to see the headline risk for the week ahead: One-third of the S&P 500 is reporting earnings this week, with a heavy emphasis on tech companies, which can often have a leading quality for shares as technology investments usually go hand in hand with bullish economic forecasts. If tech earnings disappoint, if guidance is downgraded and, in-turn, if shares move lower in response to this batch of earnings reports, traders may be able to look for a deeper retracement within the pre-defined Fibonacci structure, looking for support at 2,065.45, or 2,021.12 (the 38.2% retracement of that prior major move).
The likely determinant as to whether this uptrend remains or whether it takes a down-side turn will be FOMC on Wednesday. Should the Fed successfully do what they’ve been doing, provide support to markets by offering dovish implications around down-graded forecasts, the up-trend in the S&P could certainly continue, with eyes on prior resistance points of 2,111.37 (near-term swing high), 2,116.40 (prior swing-high), 2,125 (minor psychological level) and then the all-time high of 2,137.10.
Created with Marketscope/Trading Station II; prepared by James Stanley
--- Written by James Stanley, Analyst for DailyFX.com
To receive James Stanley’s analysis directly via email, please SIGN UP HERE
Contact and follow James on Twitter: @JStanleyFX
original source


