 S&P 500
 Talking Points:
- The US Dollar continues to see bullish price action, and over the past two days we’ve seen the Yen begin to stage a turn-around. But is this a lasting move?
- Perhaps more interesting in the bigger picture is the potential for a turn in equity markets.
- If you’re looking for trading ideas, check out our Trading Guides. And if you want something more short-term in nature, check out our SSI indicator.
It’s been a peculiar couple of weeks across markets, as a dovish Fed brought on rather significant move of US Dollar strength; and this is a move that has kept going, with the US Dollar rallying up to another fresh level of resistance yesterday, making a new high already today. And as we looked at yesterday, a sustained move of USD strength could potentially bring on some heavy reverberations, such as weakness in commodity prices like Oil.
But Oil isn’t the only market putting in interesting technical formations on the back of this recent surge in the US Dollar. Stocks have begun to show early signs of what could be ‘topping patterns,’ and commodities have staged a modicum of a pullback as USD has remained well-bid. We look at two of the more relevant markets below, along with what traders could look for to strategize around these setups.
USD/JPY
The US Dollar has been one of the strongest currencies in the world over the past week, but before that theme began this was a dubious honor bestowed upon the Japanese Yen. As risk aversion became commonplace in Q3 of last year, the Japanese Yen caught a strong bid that’s led to a move of as much as 2,000 pips. Much of what the Bank of Japan has done over the past 18 months has backfired: QE was directed to begin buying stocks in Q4 of 2014, and that’s turned out pretty rough as global stock markets began to turn over shortly after. Then they tried to move to negative rates in January of this year and that, too, caused more problems than it solved as it only seemed to hasten risk aversion. And then at their last meeting in April, they did nothing and risk aversion continued anyways as the Yen only strengthened more.
More recently, the Japanese Minister of Finance, Taro Aso, released comments indicating that the Bank of Japan would not tolerate ‘one-sided moves’ in the Yen, implying that the Bank would intervene in the spot market if need-be. But the threat of Japanese intervention isn’t new, nor would this be something that the market hadn’t seen before. There were even accusations of such on February 11th, the morning of the brisk turn-around in risk assets as Chair Yellen testified in front of Congress for her twice-annual monetary policy testimony.
Does this mean that the trend is over? Probably not, unless the BoJ can intervene enough to offset all of the selling pressure in USD/JPY, which is unlikely; but this does serve as warning towards selling while we’re near or at support. And if that’s so glaringly obvious, you have to expect that other market participants have the same inkling, so these are the types of setups that you want to wait for a more confirmed entry before triggering. We’ve been warning of a potential bottom in USD/JPY over the past couple of weeks, and have suggested that traders might, instead, wait for resistance to come in before looking for trend-resumption entries.
On the chart below, I’ve included the same Fibonacci retracement that we looked at just after the most recent BoJ meeting. As we had looked at previously, each of these retracement levels could be potential areas of resistance.
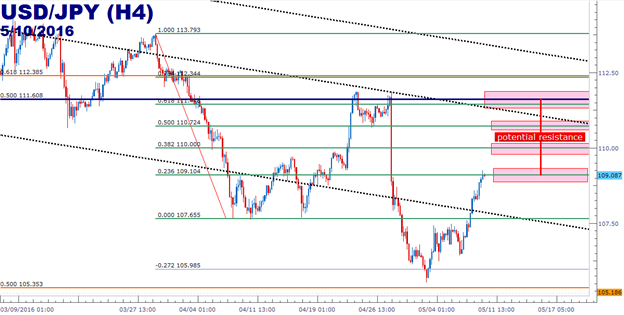
Created with Marketscope/Trading Station II; prepared by James Stanley
S&P 500
We had written on this topic just last week after the April monthly candle had completed, and this was somewhat of an early sign of a potential swing. The April monthly candle in SPX500 printed as a Doji with a lower-high, and this was the same candlestick setup that led to the major run lower to begin the year.
Last week we looked at that freshly completed candle, but as we noted, near-term price action was still bullish as prices were clinging to ‘higher highs’ and ‘higher lows.’ But this has begun to shift over the past week and, while still an early observation, could bring the potential for a larger reversal in stock prices. The chart below looks at recent price action structure, along with the levels to watch for:
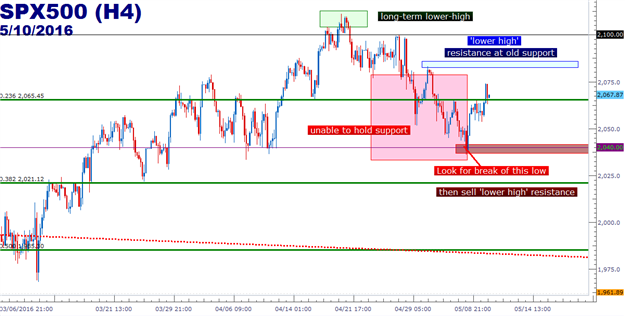
Created with Marketscope/Trading Station II; prepared by James Stanley
--- Written by James Stanley, Analyst for DailyFX.com
To receive James Stanley’s analysis directly via email, please SIGN UP HERE
Contact and follow James on Twitter: @JStanleyFX
original source


