To receive Ilya's analysis directly via email, please SIGN UP HERE
Talking Points:
- USD/CAD Technical Strategy: Flat
- Support: 1.1165, 1.1097, 1.1029
- Resistance: 1.1249, 1.1300, 1.1384
The US Dollar fell against its Canadian namesake as expected after negative RSI divergence pointed to ebbing bullish momentum below the 1.14 figure. A daily close below the 38.2% Fibonacci retracement at 1.1165 exposes the 1.1097-98 zone (50% level, September 15 high). Alternatively, a reversal above the 1.1232-49 area (channel floor support-turned-resistance, 23.6% Fib) opens the door for a challenge of the 14.6% threshold at 1.1300.
Risk/reward considerations argue against entering short with prices in close proximity to support. On the other hand, the absence of a defined bullish reversal signal suggests taking up the long side is premature. We will remain flat for now, waiting for a more actionable opportunity to present itself.
Add these technical levels directly to your charts with our Support/Resistance Wizard app!
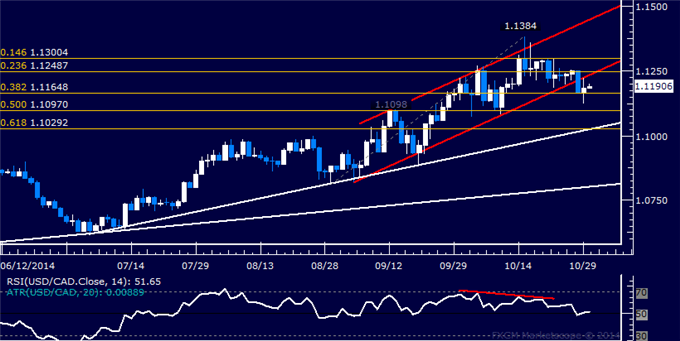
Daily Chart - Created Using FXCM Marketscope 2.0
--- Written by Ilya Spivak, Currency Strategist for DailyFX.com
original source

