To receive Ilya's analysis directly via email, please SIGN UP HERE
Talking Points:
- USD/CAD Technical Strategy: Flat
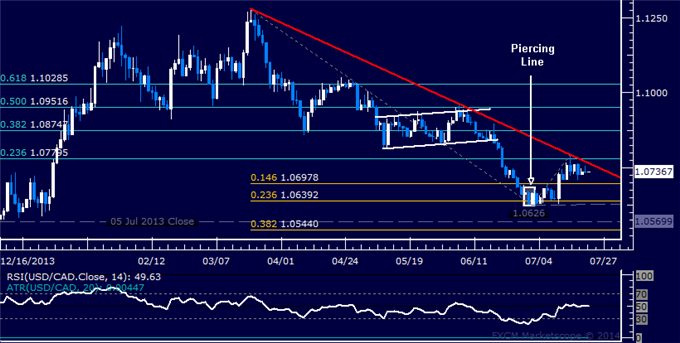
- Support: 1.0698, 1.0626-39, 1.0570
- Resistance: 1.0764-80, 1.0875, 1.0952
The US Dollar turned higher against its Canadian namesake as expected after prices completed a bullish Piercing Line candlestick pattern. A daily close above resistance in the 1.0764-80, marked by the 23.6% Fibonacci retracement and a falling trend line set from late March, exposes the 38.2% level at 1.0875. Alternatively, a reversal beneath the 14.6% Fib expansionat 1.0698 opens the door for a test of the 1.0626-39 zone (23.6% expansion, July 2 low).
Looking at the weekly chart, a bullish reversal signal hints the down move from the mid-March top has been overturned but confirmation is absent. We will opt to stand aside for now.
Add these technical levels directly to your charts with our Support/Resistance Wizard app!
Daily Chart - Created Using FXCM Marketscope 2.0
--- Written by Ilya Spivak, Currency Strategist for DailyFX.com
original source

