Talking Points
- USD/CAD Technical Strategy: Sidelines Preferred
- Doji Candlestick Indicated Reluctance From The Bulls
- H4 Chart Highlights Indecision Near the 1.1220 Floor
USD/CAD is at a critical juncture as it probes below the 1.1220 floor after a Doji signaled reluctance from the bulls to lead the pair. A daily close under the barrier may be the precursor to a deeper setback. Yet it’s susceptibility to intraday whipsaws suggests caution is warranted when adopting fresh positioning.
USD/CAD: Doji Suggested Indecision Near Recent Peaks
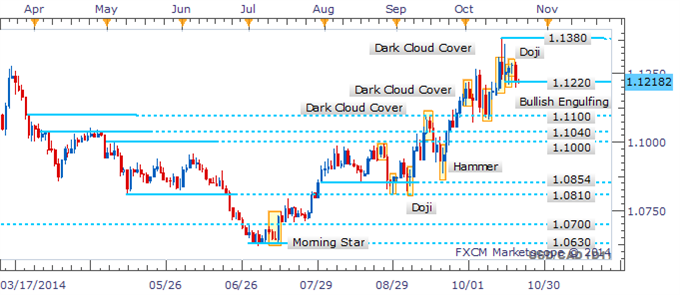
Daily Chart - Created Using FXCM Marketscope 2.0, Volume Indicator Available Here
The four hour chart highlights the extent of hesitation from traders near the 1.1215/20 barrier. A parade of Dojis does little to offer a clear directional bias over the session ahead. A close below the nearby floor would be required to warn of a more significant correction. .
USD/CAD: Intraday Dojis Highlight Indecision Near Noteworthy Floor
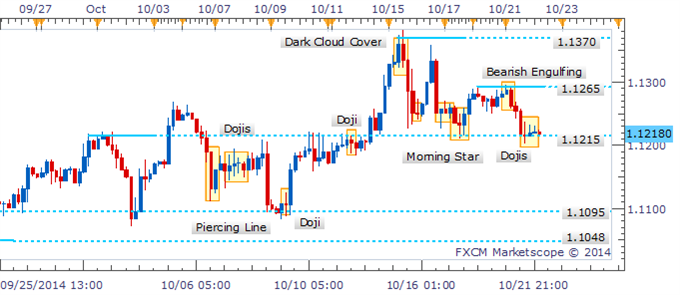
4 Hour Chart - Created Using FXCM Marketscope 2.0, Volume Indicator Available Here
By David de Ferranti, Currency Analyst, DailyFX
Follow David on Twitter: @Davidde
To receive David’s analysis directly via email, please sign up here.
Learn how to read candlesticks to help identify trading opportunities with the DailyFX Candlesticks Video Course.
original source


