Talking Points:
- USD/JPY trading sideways around the 101 handle
- All eyes on US NFPs as the pair appears poised for a short term technical break
- GSI is a powerful big data indicator that can help you determine whether short-term trends will continue or reverse
The USD/JPY is trading sideways around the 101 handle in the last couple of trading days after sinking lower following perceived disappointments from the BOJ monetary policy announcement and the Japanese new fiscal stimulus plans.
This short term sideways congestion puts the focus firmly on the US NPFs later today for a possible range break catalyst.
Taking this into consideration, we look to find short term trading opportunities using the Grid Sight Index (GSI) indicator.
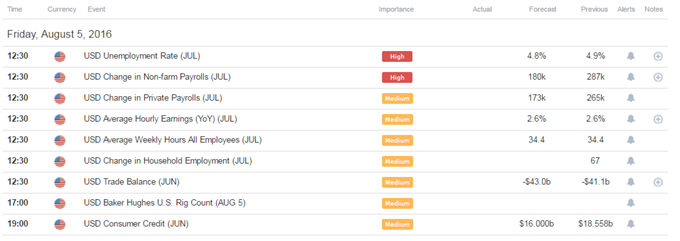
Click Here for the DailyFX Calendar
The US Non-farm Payrolls take center stage today. The headline figure is expected to show 180k increase in payrolls versus the prior huge 287k print, and the unemployment figure is expected to tick down to 4.8% from the prior 4.9% figure.
The May and June figures saw a huge miss and beat to expectations respectively. This makes today’s numbers seem even more of an unknown. The context, as it relates to the US Dollar, might be what the figures could imply on the backdrop of Friday’s huge 2Q US GDP disappointment.
A huge beat to expectations (preferably with a beat in wage growth as well) might shift sentiment to a more upbeat tone on the US economy, and seems likely to send the US Dollar higher.
The opposite appears likely to paint a gloomy picture after Friday’s GDP figures and could potentially send the US Dollar tumbling.
With that said, the more interesting scenario here from an actual trading perspective might potentially be a slight beat to expectation or numbers generally in line with consensus. In this scenario, an initial knee-jerk positive US Dollar reaction might provide more favorable prices for sellers looking into the general USD/JPY longer term downtrend in the context of lower than expected US growth, reduced Fed rate hike bets and limited scope of further stimulus in Japan.
USD/JPY 5-Min GSI Chart: August 5, 2016
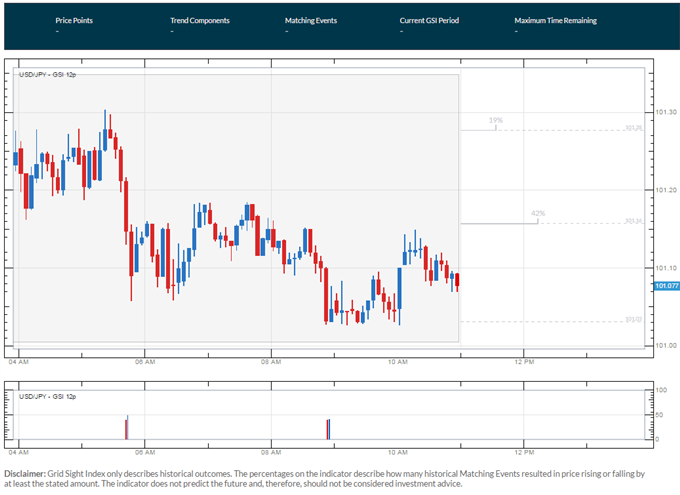
The USD/JPY is trading above prior support at 101.00 at the time of writing, with the last two GSI readings calculating about even percentage of past movement to either side, which is generally in line with the short term sideways trend. The GSI indicator above calculates the distribution of past event outcomes given certain momentum patterns, and can give you a look at the market in a way that's never been possible before, analyzing millions of historical prices in real time. By matching events in the past, GSI describes how often the price moved in a certain direction.
You can learn more about the GSI here.
USD/JPY Technical Levels:

Click here for the DailyFX Support & Resistance tool
We use volatility measures as a way to better fit our strategy to market conditions. The Yen is expected to be the second most volatile currency versus the US Dollar on a 1-Week implied volatility basis (after the British Pound). This is understandable given the unfolding events in Japan, FX intervention risk and possible influence of today’s figures. In turn, this could imply that breakout type trades might be preferable in the short term.
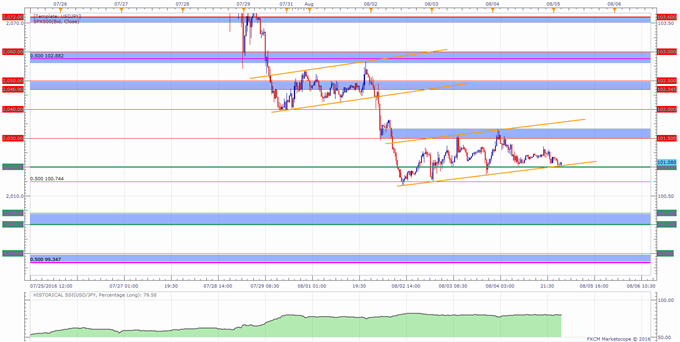
USD/JPY 30-Min Chart: August 5, 2016
(Click to Enlarge)
The USD/JPY is trading in a downtrend with the pair currently confined in a technical trading channel usually seen as a corrective phase. This could imply that the pair is poised for a break to the downside but NFPs could change the picture quickly to either direction for a technical break.
Key levels to watch as resistance appear to be a zone above the 101.50 level, the 102 handle, 102.345 and an area below 103.00.
The main levels of support on a move lower might be 100.75, an area between 100.2 and the 100 handle, followed by what appears to be an interesting area below the 99.50 level and the 99.00 figure.
When price reaches those levels, short term traders might use the GSI to view how prices reacted in the past given a certain momentum pattern, and see the distribution of historical outcomes in which the price reversed or continued in the same direction. We generally want to see GSI with the historical patterns significantly shifted in one direction, which could potentially be used with a pre-determined bias as well.
A common way to use GSI is to help you fade tops and bottoms, and trade breakouts. That’s why traders may want to use the GSI indicator when price reaches those specific pre-determined levels, and fit a strategy that can offer a proper way to define risk. We studied over 43 million real trades and found that traders who do that were three times more likely to turn a profit. Read more on the “Traits of Successful Traders” research.
Meanwhile, the DailyFX Speculative Sentiment Index (SSI) is showing that about 79.5% of FXCM’s traders are long the USD/JPY at the time of writing, on the wrong side of the latest downs leg from around 107. The SSI is mainly used as a contrarian indicator implying possible further weakness ahead.
You can find more info about the DailyFX SSI indicator here
--- Written by Oded Shimoni, Junior Currency Analyst for DailyFX.com
To contact Oded Shimoni, e-mail oshimoni@dailyfx.com
Follow him on Twitter at @OdedShimoni
original source


