USD/JPY Technical Analysis- Prices declined as expected after putting in a Bearish Engulfing candlestick pattern. The pair found interim support in the 95.90-96.70 area, marked by a rising trend line set from late February and the March 12 high. A Hammer candlestick hints a bounce may be ahead. Initial resistance is at 98.32, the 38.2% Fibonacci retracement, with a break above that targeting the 50% level at 99.35.
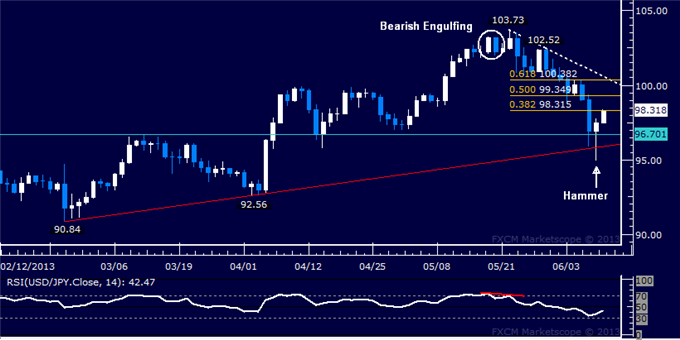
Daily Chart - Created Using FXCM Marketscope 2.0
--- Written by Ilya Spivak, Currency Strategist for Dailyfx.com
To contact Ilya, e-mail ispivak@dailyfx.com. Follow Ilya on Twitter at @IlyaSpivak
To be added to Ilya's e-mail distribution list, please CLICK HERE
New to FX? Watch this Video. For live market updates, visit the Real Time News Feed


