
Chart 1: Performance by asset class and investor average
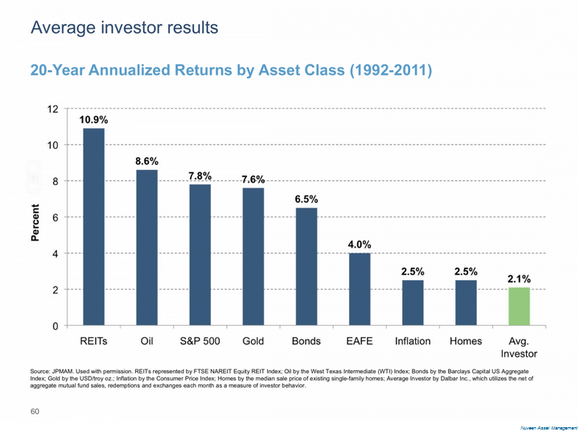
Source : JP Morgan
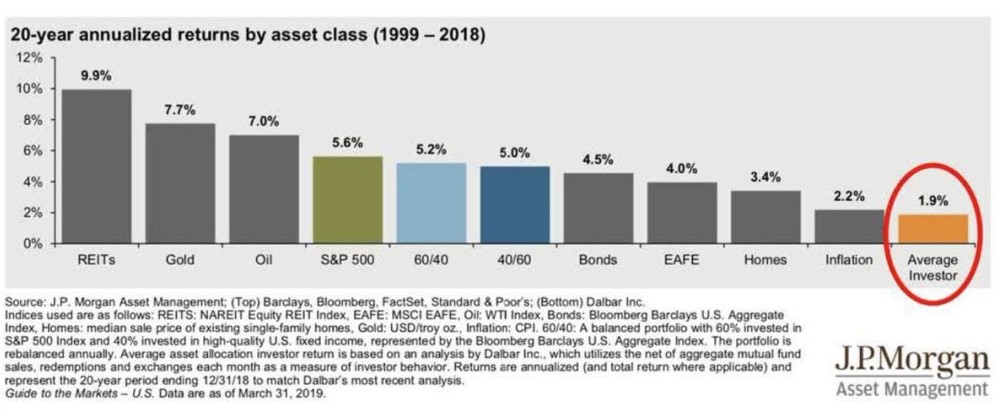
Source : JP Morgan
The average individual investor underperforms the market and all the asset classes here, with an annualized performance of 2.1% between 1992 and 2011 and 1.9% between 1999 and 2018. REITS, listed US real estate companies, delivered the best performance over the two periods studied (1992-2011 and 1999-2018). The S&P 500 achieved an average return of 5.6% between 1999 and 2018 (with the famous lost decade of 2000-2010 and ending with 2018, a poor vintage). So why are retail investors underperforming to such an extent? Is market-timing to blame? Emotional management? Buying trendy stocks at the wrong time? Probably a bit of all of the above.
Chart 2: Nasdaq-100 driven by the behemoths
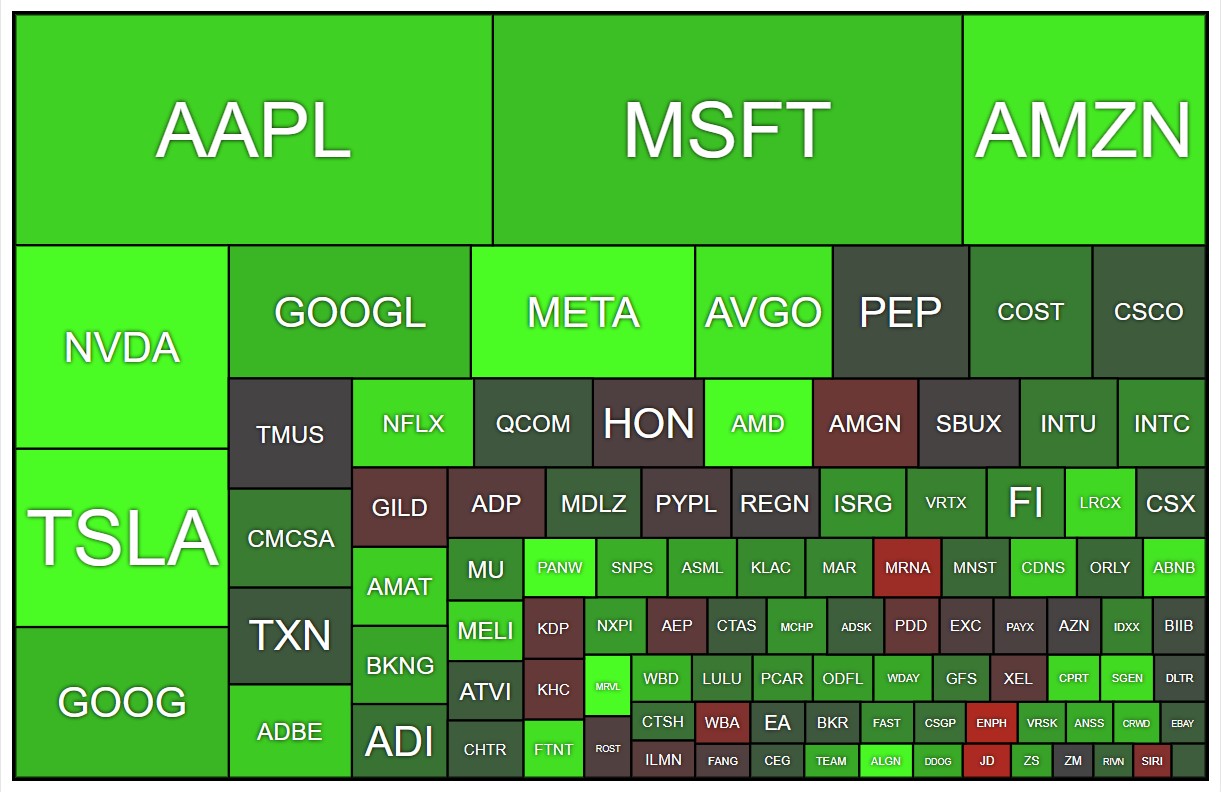
Source: MarketScreener
The American index set a new all-time record for the first half of the year with a performance of +38.7%, the first time this has ever happened in the first six months of a year. Nvidia gained 190%, Meta Platforms 144%, Tesla 127%, Palo Alto Networks 84%, AMD 78%, Align Technology 63%, Marvell Technology 61%, Amazon 55%, Broadcom 54% and Airbnb 54%. The 7 biggest US tech companies account for more than ¾ of the index's rise this year. Suffice to say, if you didn't have them in your portfolio at the start of the year, it was hard to outperform the market in the first half.
Chart 3: Commodity performance over the last decade
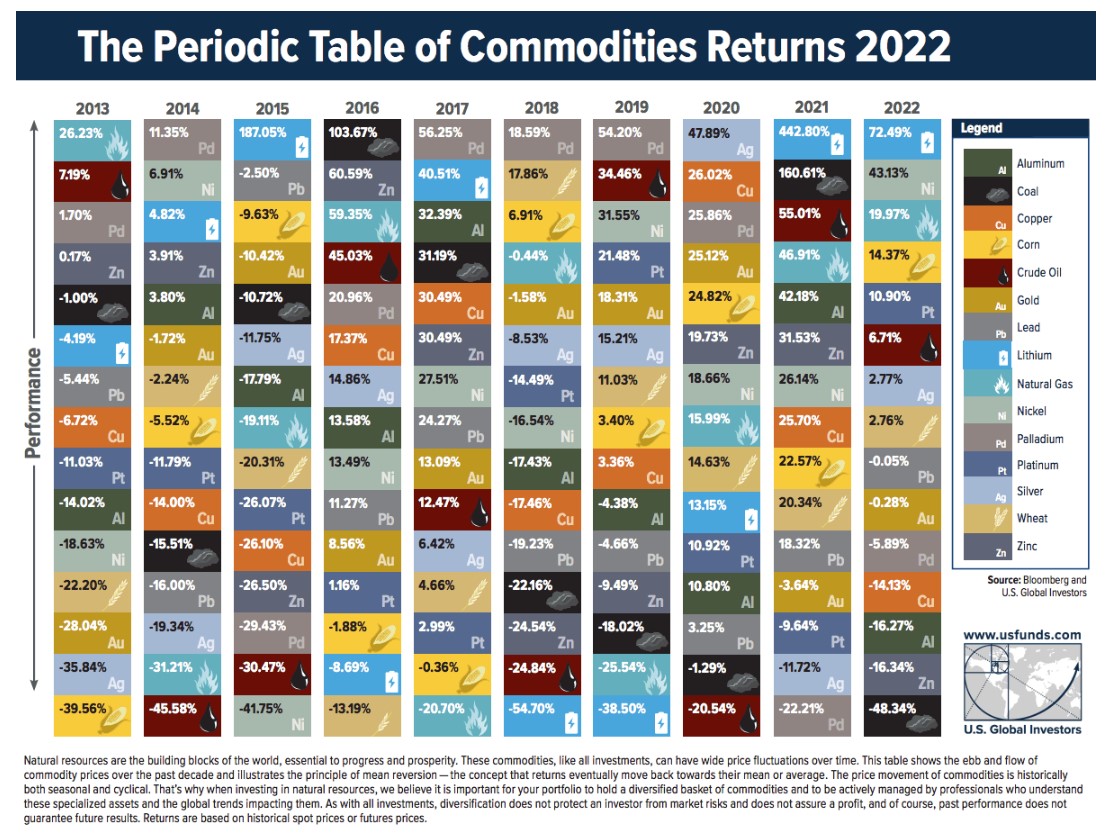
Source: Visual Capitalist
This chart represents the stock market performance of various commodities between 2013 and 2022. The general S&P Goldman Commodity Index (GSCI) gained over 50% in the first five months of 2022, mainly due to the war in Ukraine, tensions in supply chains and fears over oil, gas and grains. Lithium exploded in 2021 and 2022, with performances of +442.8% and +72.5% respectively, but the rise calmed down severely in 2023. All in all, as you can see, returns are quite volatile and it's very difficult, if not impossible, to anticipate future prices.
Chart 4: Largest market capitalizations since 1960
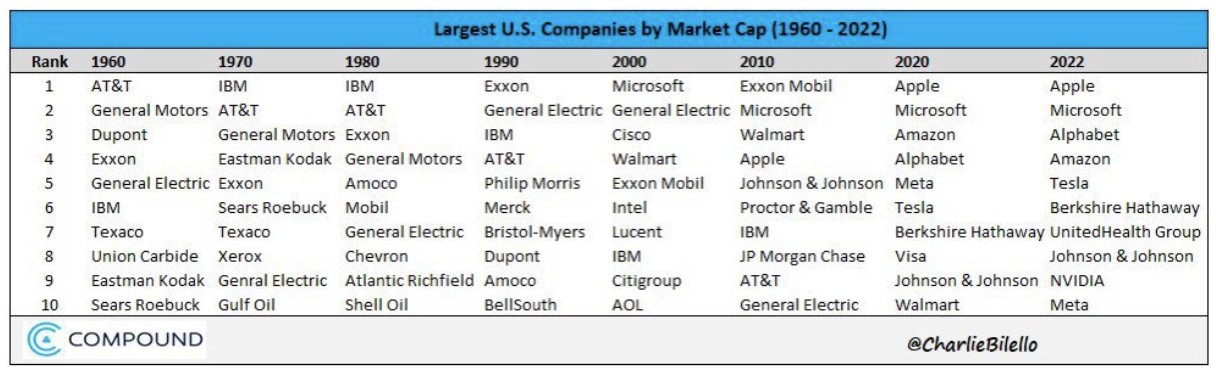
Source: Charlie Bilello
This chart represents the top 10 listed US companies, ranked by market capitalization. None of the 10 companies in the top 10 will be there again in 2022. There are a few exceptions, such as General Electric, which remained in the top 10 for over 50 years, notably between 1960 and 2010. This table shows that yesterday's leaders will not necessarily be tomorrow's leaders. Times change, sometimes faster than expected. Take the example of Sears Roebuck, which dominated the food retailing market in 1970-80, only to be overtaken by Walmart the following decade.
Chart 5: A quality company
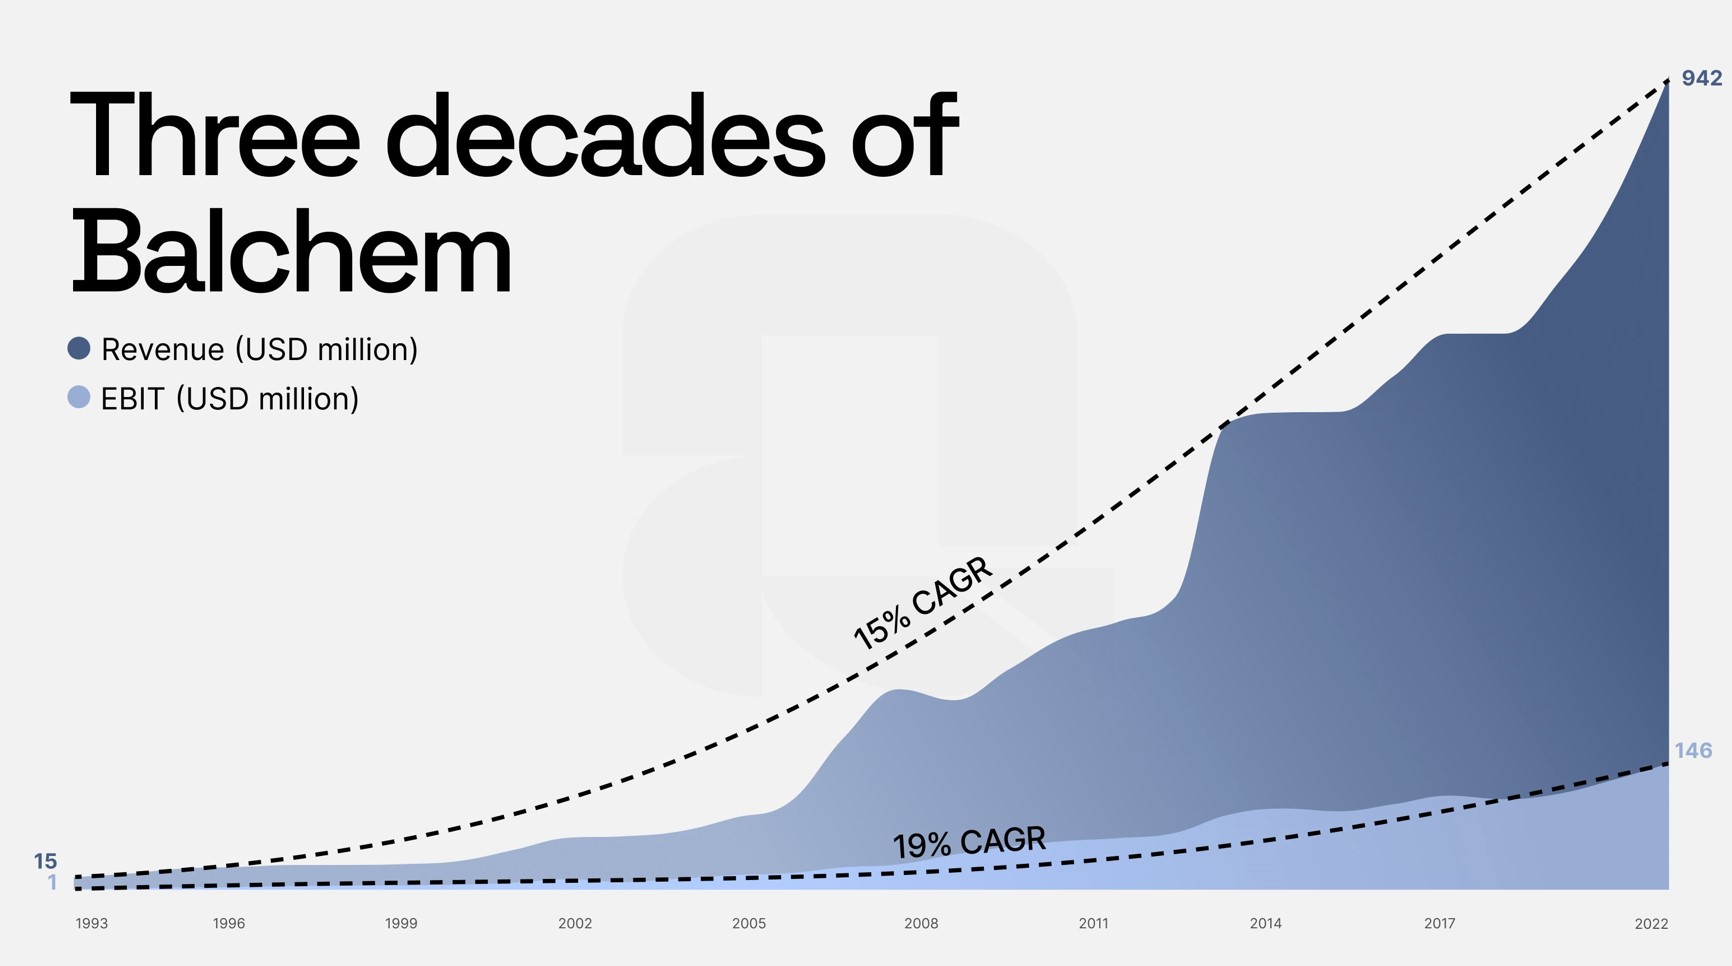
Source: Quartr
US-listed Balchem Corporation, not to be confused with Switzerland's Bachem Holdings, manufactures and markets specialized ingredients and performance products for the nutrition, pharmaceutical, animal health, medical device sterilization and industrial markets. With over 55 years of history and a diversified portfolio of activities, Balchem has built a solid reputation. Annualized growth (CAGR) in sales since 1993 has been 15%, and operating profit 19%. Although this growth has slowed over the last decade, Balchem is still growing faster than US GDP, generating over 72% of its revenues in the USA. The balance sheet structure is sound, with financial leverage (net debt/EBITDA) below 2. Return on equity (ROE) is expected to reach 11.6% in 2022.


